Travelers 2009 Annual Report Download - page 196
Download and view the complete annual report
Please find page 196 of the 2009 Travelers annual report below. You can navigate through the pages in the report by either clicking on the pages listed below, or by using the keyword search tool below to find specific information within the annual report.-
 1
1 -
2
-
3
-
4
-
5
-
6
-
7
-
8
-
9
-
10
-
11
-
12
-
13
-
14
-
15
-
16
-
17
-
18
-
19
-
20
-
21
-
22
-
23
-
24
-
25
-
26
-
27
-
28
-
29
-
30
-
31
-
32
-
33
-
34
-
35
-
36
-
37
-
38
-
39
-
40
-
41
-
42
-
43
-
44
-
45
-
46
-
47
-
48
-
49
-
50
-
51
-
52
-
53
-
54
-
55
-
56
-
57
-
58
-
59
-
60
-
61
-
62
-
63
-
64
-
65
-
66
-
67
-
68
-
69
-
70
-
71
-
72
-
73
-
74
-
75
-
76
-
77
-
78
-
79
-
80
-
81
-
82
-
83
-
84
-
85
-
86
-
87
-
88
-
89
-
90
-
91
-
92
-
93
-
94
-
95
-
96
-
97
-
98
-
99
-
100
-
101
-
102
-
103
-
104
-
105
-
106
-
107
-
108
-
109
-
110
-
111
-
112
-
113
-
114
-
115
-
116
-
117
-
118
-
119
-
120
-
121
-
122
-
123
-
124
-
125
-
126
-
127
-
128
-
129
-
130
-
131
-
132
-
133
-
134
-
135
-
136
-
137
-
138
-
139
-
140
-
141
-
142
-
143
-
144
-
145
-
146
-
147
-
148
-
149
-
150
-
151
-
152
-
153
-
154
-
155
-
156
-
157
-
158
-
159
-
160
-
161
-
162
-
163
-
164
-
165
-
166
-
167
-
168
-
169
-
170
-
171
-
172
-
173
-
174
-
175
-
176
-
177
-
178
-
179
-
180
-
181
-
182
-
183
-
184
-
185
-
 186
186 -
 187
187 -
 188
188 -
 189
189 -
 190
190 -
 191
191 -
 192
192 -
 193
193 -
 194
194 -
 195
195 -
 196
196 -
 197
197 -
 198
198 -
 199
199 -
 200
200 -
 201
201 -
 202
202 -
 203
203 -
 204
204 -
 205
205 -
 206
206 -
207
-
208
-
209
-
210
-
211
-
212
-
213
-
214
-
215
-
216
-
217
-
218
-
219
-
220
-
221
-
222
-
223
-
224
-
225
-
226
-
227
-
228
-
229
-
230
-
231
-
232
-
233
-
234
-
235
-
236
-
237
-
238
-
239
-
240
-
241
-
242
-
243
-
244
-
245
-
246
-
247
-
248
-
249
-
250
-
251
-
252
-
253
-
254
-
255
-
256
-
257
-
258
-
259
-
260
-
261
-
262
-
263
-
264
-
265
-
266
-
267
-
268
-
269
-
270
-
271
-
272
-
273
-
274
-
275
-
276
-
277
-
278
-
279
-
280
-
281
-
282
-
283
-
284
-
285
-
286
-
287
-
288
-
289
-
290
-
291
-
292
-
293
-
294
-
295
 |
 |

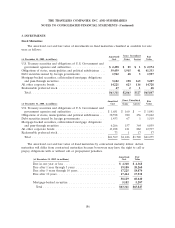
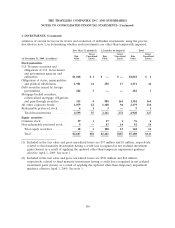
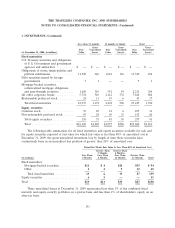
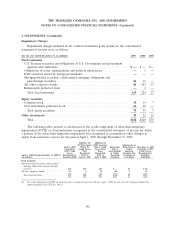
THE TRAVELERS COMPANIES, INC. AND SUBSIDIARIES
NOTES TO CONSOLIDATED FINANCIAL STATEMENTS (Continued)
2. SEGMENT INFORMATION (Continued)
Business Segment Reconciliations
(for the year ended
December 31, in millions) 2009 2008 2007
Revenue reconciliation
Earned premiums
Business Insurance:
Commercial multi-peril ................................. $ 2,894 $ 2,988 $ 3,087
Workers’ compensation ................................. 2,457 2,373 2,221
Commercial automobile................................. 1,956 1,957 2,026
Property ............................................ 1,761 1,895 1,989
General liability....................................... 1,899 1,959 1,917
Other.............................................. 1843
Total Business Insurance............................... 10,968 11,180 11,283
Financial, Professional & International Insurance:
Fidelity and surety..................................... 1,015 1,063 979
General liability....................................... 929 904 951
International......................................... 1,255 1,328 1,322
Other.............................................. 134 134 132
Total Financial, Professional & International Insurance . . . . . . . . . 3,333 3,429 3,384
Personal Insurance:
Automobile.......................................... 3,696 3,708 3,692
Homeowners and Other................................. 3,421 3,262 3,111
Total Personal Insurance............................... 7,117 6,970 6,803
Total earned premiums................................ 21,418 21,579 21,470
Net investment income..................................... 2,776 2,792 3,761
Fee income ............................................. 306 390 508
Other revenues .......................................... 153 129 143
Total operating revenues for reportable segments . . . . . . . . . . . . . . . . . . 24,653 24,890 25,882
Other revenues .......................................... 10 2 (19)
Net realized investment gains (losses) . . . . . . . . . . . . . . . . . . . . . . . . . . 17 (415) 154
Total consolidated revenues .............................. $24,680 $24,477 $26,017
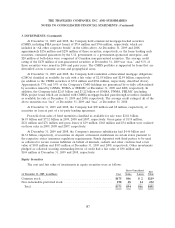
Income reconciliation, net of tax
Total operating income for reportable segments . . . . . . . . . . . . . . . . . . . $ 3,833 $ 3,452 $ 4,709
Interest Expense and Other(1) . . . . . . . . . . . . . . . . . . . . . . . . . . . . . . . (233) (257) (209)
Total operating income ................................. 3,600 3,195 4,500
Net realized investment gains (losses) . . . . . . . . . . . . . . . . . . . . . . . . . . 22 (271) 101
Total consolidated net income . . . . . . . . . . . . . . . . . . . . . . . . . . . . $ 3,622 $ 2,924 $ 4,601
(1) The primary component of Interest Expense and Other is after-tax interest expense of
$248 million, $239 million and $224 million in 2009, 2008 and 2007, respectively. The operating
184