Travelers 2009 Annual Report Download - page 89
Download and view the complete annual report
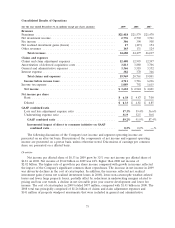
Please find page 89 of the 2009 Travelers annual report below. You can navigate through the pages in the report by either clicking on the pages listed below, or by using the keyword search tool below to find specific information within the annual report.fair value. Equity impairments in 2009 were $79 million, the majority of which were related to issuers
in the financial services industry. Impairments in 2009 also included $10 million related to other
investments.
The 2008 impairments included $186 million related to the deteriorated financial position of
various issuers (including $70 million related to securities issued by Lehman Brothers Holdings Inc. and
its subsidiaries), $113 million related to externally managed securities with respect to which the
Company did not have the ability to assert an intention to hold until recovery in fair value, $64 million
related to structured mortgage securities and $57 million related to securities the Company had
identified for potential sale prior to a recovery in fair value.
Impairments in 2007 included $30 million related to externally managed securities with respect to
which the Company did not have the ability to assert an intention to hold until recovery in fair value,
$30 million related to the deteriorated financial position of various issuers and $10 million related to
the decline in the financial condition of one real estate development property.
Further information regarding the nature of impairment charges in each year is included in the
‘‘Investment Portfolio’’ section later in this discussion.
Other Net Realized Investment Gains—Other net realized investment gains for 2009 were
$275 million, compared with $5 million in 2008. In October 2009, the Company sold a portion of its
common stock holdings in Verisk Analytics, Inc. (Verisk) for total proceeds of approximately
$184 million as part of the initial public offering (IPO) of Verisk. The Company recorded a pretax
realized investment gain of $159 million on this sale in the fourth quarter of 2009. Other net realized
investment gains in 2009 also included $100 million of net realized investment gains related to fixed
maturity investments, $23 million of net realized investment gains associated with the U.S. Treasury
futures contracts (which require a daily mark-to-market settlement and are used to shorten the
duration of the Company’s fixed maturity investment portfolio) and $23 million of net realized
investment losses related to foreign exchange.
Other net realized investment gains in 2008 included $50 million related to foreign currency
exchange gains, $39 million from the sale of subsidiaries, $29 million from the sale of fixed maturity
securities and $17 million of net realized investment gains from the sale of venture capital investments.
Partially offsetting these realized investment gains in 2008 were net realized losses of $77 million
related to convertible bonds wherein the embedded option price is marked to market through realized
gains or losses and $53 million of losses related to U.S. Treasury futures contracts.
Other net realized investment gains in 2007 included $107 million of net realized investment gains
generated by the venture capital portfolio (including an $81 million net realized investment gain from
the bundled sale of a substantial portion of the Company’s venture capital investment holdings),
$63 million of net realized investment gains from the sale of a privately held security, $21 million of net
realized investment gains related to the Company’s holdings of stock purchase warrants of Platinum
Underwriters Holdings, Ltd., a publicly-held company, and $5 million of net realized investment gains
from the Company’s fixed maturity portfolio. These gains were partially offset by a net realized
investment loss of $24 million related to the divestiture of a subsidiary.
Other Revenues
Other revenues primarily consist of premium installment charges. In 2007, other revenues also
included a $39 million loss related to the Company’s redemption of its 4.50% convertible junior
subordinated notes in April 2007, consisting of the redemption premium paid and the write-off of
remaining debt issuance costs.
77


