Travelers 2009 Annual Report Download - page 100
Download and view the complete annual report
Please find page 100 of the 2009 Travelers annual report below. You can navigate through the pages in the report by either clicking on the pages listed below, or by using the keyword search tool below to find specific information within the annual report.-
 1
1 -
2
-
3
-
4
-
5
-
6
-
7
-
8
-
9
-
10
-
11
-
12
-
13
-
14
-
15
-
16
-
17
-
18
-
19
-
20
-
21
-
22
-
23
-
24
-
25
-
26
-
27
-
28
-
29
-
30
-
31
-
32
-
33
-
34
-
35
-
36
-
37
-
38
-
39
-
40
-
41
-
42
-
43
-
44
-
45
-
46
-
47
-
48
-
49
-
50
-
51
-
52
-
53
-
54
-
55
-
56
-
57
-
58
-
59
-
60
-
61
-
62
-
63
-
64
-
65
-
66
-
67
-
68
-
69
-
70
-
71
-
72
-
73
-
74
-
75
-
76
-
77
-
78
-
79
-
80
-
81
-
82
-
83
-
84
-
85
-
86
-
87
-
88
-
89
-
 90
90 -
 91
91 -
 92
92 -
 93
93 -
 94
94 -
 95
95 -
 96
96 -
 97
97 -
 98
98 -
 99
99 -
 100
100 -
 101
101 -
 102
102 -
 103
103 -
 104
104 -
 105
105 -
 106
106 -
 107
107 -
 108
108 -
 109
109 -
 110
110 -
111
-
112
-
113
-
114
-
115
-
116
-
117
-
118
-
119
-
120
-
121
-
122
-
123
-
124
-
125
-
126
-
127
-
128
-
129
-
130
-
131
-
132
-
133
-
134
-
135
-
136
-
137
-
138
-
139
-
140
-
141
-
142
-
143
-
144
-
145
-
146
-
147
-
148
-
149
-
150
-
151
-
152
-
153
-
154
-
155
-
156
-
157
-
158
-
159
-
160
-
161
-
162
-
163
-
164
-
165
-
166
-
167
-
168
-
169
-
170
-
171
-
172
-
173
-
174
-
175
-
176
-
177
-
178
-
179
-
180
-
181
-
182
-
183
-
184
-
185
-
186
-
187
-
188
-
189
-
190
-
191
-
192
-
193
-
194
-
195
-
196
-
197
-
198
-
199
-
200
-
201
-
202
-
203
-
204
-
205
-
206
-
207
-
208
-
209
-
210
-
211
-
212
-
213
-
214
-
215
-
216
-
217
-
218
-
219
-
220
-
221
-
222
-
223
-
224
-
225
-
226
-
227
-
228
-
229
-
230
-
231
-
232
-
233
-
234
-
235
-
236
-
237
-
238
-
239
-
240
-
241
-
242
-
243
-
244
-
245
-
246
-
247
-
248
-
249
-
250
-
251
-
252
-
253
-
254
-
255
-
256
-
257
-
258
-
259
-
260
-
261
-
262
-
263
-
264
-
265
-
266
-
267
-
268
-
269
-
270
-
271
-
272
-
273
-
274
-
275
-
276
-
277
-
278
-
279
-
280
-
281
-
282
-
283
-
284
-
285
-
286
-
287
-
288
-
289
-
290
-
291
-
292
-
293
-
294
-
295
 |
 |

general economic conditions and a decline in new business volume. Partially offsetting the declines in
these business units was strong growth in National Property premium volume in 2009 due to significant
increases in renewal premium changes. Excess Casualty written premiums also increased over 2008, due
to a change in the terms of certain reinsurance treaties that resulted in a higher level of business
retained.
Net written premiums of $1.59 billion in 2008 decreased 4% from 2007. The decline was
concentrated in the National Property business unit, reflecting reductions in renewal price changes and
new business volume due to competitive market conditions, and in the Inland Marine business unit,
primarily reflecting reductions in business retention rates and new business volume due to general
economic conditions. In addition, the Global Accounts business unit experienced a reduction in net
written premiums due to declines in business retention rates, renewal price changes and new business.
Partially offsetting the declines in these business units was an increase in net written premiums in the
Excess Casualty business unit, where renewal price changes remained negative but improved over 2007
and business retention levels increased.
Specialized Distribution. In 2009, net written premiums of $889 million were 5% lower than in
2008. The decline was attributable to both the National Programs and Northland business units, which
experienced continued negative renewal premium changes that reflected competitive market conditions
and the impact of economic conditions, primarily on the commercial trucking, entertainment and
leisure industries.
Net written premiums of $939 million in 2008 decreased 7% from 2007. The premium decline
reflected negative renewal price changes in both the Northland and National Programs business units.
In the National Programs business unit, business retention rates increased over 2007, but new business
levels declined compared with 2007. In the Northland business unit, business retention rates and new
business levels remained strong, but were down slightly compared with 2007.
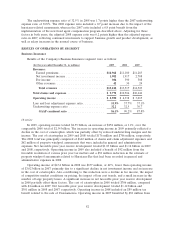
Financial, Professional & International Insurance
Results of the Company’s Financial, Professional & International Insurance segment were as
follows:
(for the year ended December 31, in millions) 2009 2008 2007
Revenues:
Earned premiums ............................ $3,333 $3,429 $3,384
Net investment income ........................ 452 454 494
Other revenues.............................. 27 24 29
Total revenues ............................... $3,812 $3,907 $3,907
Total claims and expenses ........................ $2,948 $3,004 $2,981
Operating income .............................. $ 642 $ 649 $ 675
Loss and loss adjustment expense ratio . . . . . . . . . . . . . . 52.1% 51.2% 50.8%
Underwriting expense ratio . . . . . . . . . . . . . . . . . . . . . . . 36.0 36.0 36.8
GAAP combined ratio ......................... 88.1% 87.2% 87.6%
Overview
In 2009, operating income of $642 million was $7 million, or 1%, lower than in 2008. A reduction
in net favorable prior year reserve development was largely offset by a decline in the cost of
catastrophes and lower large losses in the International group. Net favorable prior year reserve
88