Travelers 2009 Annual Report Download - page 94
Download and view the complete annual report
Please find page 94 of the 2009 Travelers annual report below. You can navigate through the pages in the report by either clicking on the pages listed below, or by using the keyword search tool below to find specific information within the annual report.-
 1
1 -
2
-
3
-
4
-
5
-
6
-
7
-
8
-
9
-
10
-
11
-
12
-
13
-
14
-
15
-
16
-
17
-
18
-
19
-
20
-
21
-
22
-
23
-
24
-
25
-
26
-
27
-
28
-
29
-
30
-
31
-
32
-
33
-
34
-
35
-
36
-
37
-
38
-
39
-
40
-
41
-
42
-
43
-
44
-
45
-
46
-
47
-
48
-
49
-
50
-
51
-
52
-
53
-
54
-
55
-
56
-
57
-
58
-
59
-
60
-
61
-
62
-
63
-
64
-
65
-
66
-
67
-
68
-
69
-
70
-
71
-
72
-
73
-
74
-
75
-
76
-
77
-
78
-
79
-
80
-
81
-
82
-
83
-
 84
84 -
 85
85 -
 86
86 -
 87
87 -
 88
88 -
 89
89 -
 90
90 -
 91
91 -
 92
92 -
 93
93 -
 94
94 -
 95
95 -
 96
96 -
 97
97 -
 98
98 -
 99
99 -
 100
100 -
 101
101 -
 102
102 -
 103
103 -
 104
104 -
105
-
106
-
107
-
108
-
109
-
110
-
111
-
112
-
113
-
114
-
115
-
116
-
117
-
118
-
119
-
120
-
121
-
122
-
123
-
124
-
125
-
126
-
127
-
128
-
129
-
130
-
131
-
132
-
133
-
134
-
135
-
136
-
137
-
138
-
139
-
140
-
141
-
142
-
143
-
144
-
145
-
146
-
147
-
148
-
149
-
150
-
151
-
152
-
153
-
154
-
155
-
156
-
157
-
158
-
159
-
160
-
161
-
162
-
163
-
164
-
165
-
166
-
167
-
168
-
169
-
170
-
171
-
172
-
173
-
174
-
175
-
176
-
177
-
178
-
179
-
180
-
181
-
182
-
183
-
184
-
185
-
186
-
187
-
188
-
189
-
190
-
191
-
192
-
193
-
194
-
195
-
196
-
197
-
198
-
199
-
200
-
201
-
202
-
203
-
204
-
205
-
206
-
207
-
208
-
209
-
210
-
211
-
212
-
213
-
214
-
215
-
216
-
217
-
218
-
219
-
220
-
221
-
222
-
223
-
224
-
225
-
226
-
227
-
228
-
229
-
230
-
231
-
232
-
233
-
234
-
235
-
236
-
237
-
238
-
239
-
240
-
241
-
242
-
243
-
244
-
245
-
246
-
247
-
248
-
249
-
250
-
251
-
252
-
253
-
254
-
255
-
256
-
257
-
258
-
259
-
260
-
261
-
262
-
263
-
264
-
265
-
266
-
267
-
268
-
269
-
270
-
271
-
272
-
273
-
274
-
275
-
276
-
277
-
278
-
279
-
280
-
281
-
282
-
283
-
284
-
285
-
286
-
287
-
288
-
289
-
290
-
291
-
292
-
293
-
294
-
295
 |
 |

The underwriting expense ratio of 32.5% in 2008 was 1.7 points higher than the 2007 underwriting
expense ratio of 30.8%. The 2008 expense ratio included a 0.7 point increase due to the impact of the
hurricane-related assessments, whereas the 2007 ratio included a 0.8 point benefit from the
implementation of the new fixed agent compensation program described above. Adjusting for these
factors in both years, the adjusted 2008 expense ratio was 0.2 points higher than the adjusted expense
ratio in 2007, reflecting continued investments to support business growth and product development, as
well as salary increases in the normal course of business.
RESULTS OF OPERATIONS BY SEGMENT
Business Insurance
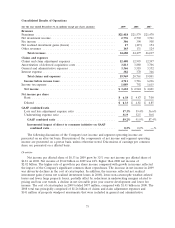
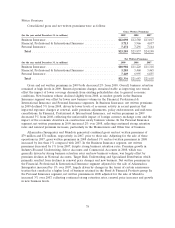
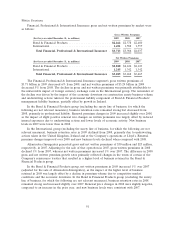
Results of the Company’s Business Insurance segment were as follows:
(for the year ended December 31, in millions) 2009 2008 2007
Revenues:
Earned premiums.......................... $10,968 $11,180 $11,283
Net investment income . . . . . . . . . . . . . . . . . . . . . . 1,902 1,917 2,708
Fee income .............................. 306 390 508
Other revenues ........................... 42 30 24
Total revenues .......................... $13,218 $13,517 $14,523
Total claims and expenses ..................... $ 9,778 $10,506 $10,444
Operating income ........................... $ 2,590 $ 2,338 $ 3,015
Loss and loss adjustment expense ratio . . . . . . . . . . . . 53.9% 57.7% 57.1%
Underwriting expense ratio . . . . . . . . . . . . . . . . . . . . 32.2 32.5 30.7
GAAP combined ratio ..................... 86.1% 90.2% 87.8%
Overview
In 2009, operating income totaled $2.59 billion, an increase of $252 million, or 11%, over the
comparable 2008 total of $2.34 billion. The increase in operating income in 2009 primarily reflected a
decline in the cost of catastrophes, which was partially offset by reduced underwriting margins and fee
income. The cost of catastrophes in 2009 and 2008 totaled $176 million and $706 million, respectively.
The 2008 total was principally comprised of $642 million of claims and claim adjustment expenses and
$62 million of property windpool assessments that were included in general and administrative
expenses. Net favorable prior year reserve development totaled $1.03 billion and $1.12 billion in 2009
and 2008, respectively. Operating income in 2009 also included a benefit of $42 million from the
favorable resolution of various prior year tax matters and a $38 million reduction in the estimate of
property windpool assessments related to Hurricane Ike that had been recorded in general and
administrative expenses in 2008.
Operating income of $2.34 billion in 2008 was $677 million, or 22%, lower than operating income
of $3.02 billion in 2007, primarily due to a significant decline in net investment income and an increase
in the cost of catastrophes. Also contributing to this reduction were a decline in fee income, the impact
of competitive market conditions on pricing, the impact of loss cost trends, and a small increase in the
number of large property losses. A significant increase in net favorable prior year reserve development
in 2008 partially offset these factors. The cost of catastrophes in 2008 totaled $706 million, compared
with $4 million in 2007. Net favorable prior year reserve development totaled $1.12 billion and
$301 million in 2008 and 2007, respectively. Operating income in 2008 included an $89 million tax
benefit related to the sale of Unionamerica. Operating income in 2007 benefited by $81 million from
82