Travelers 2009 Annual Report Download - page 175
Download and view the complete annual report
Please find page 175 of the 2009 Travelers annual report below. You can navigate through the pages in the report by either clicking on the pages listed below, or by using the keyword search tool below to find specific information within the annual report.-
 1
1 -
2
-
3
-
4
-
5
-
6
-
7
-
8
-
9
-
10
-
11
-
12
-
13
-
14
-
15
-
16
-
17
-
18
-
19
-
20
-
21
-
22
-
23
-
24
-
25
-
26
-
27
-
28
-
29
-
30
-
31
-
32
-
33
-
34
-
35
-
36
-
37
-
38
-
39
-
40
-
41
-
42
-
43
-
44
-
45
-
46
-
47
-
48
-
49
-
50
-
51
-
52
-
53
-
54
-
55
-
56
-
57
-
58
-
59
-
60
-
61
-
62
-
63
-
64
-
65
-
66
-
67
-
68
-
69
-
70
-
71
-
72
-
73
-
74
-
75
-
76
-
77
-
78
-
79
-
80
-
81
-
82
-
83
-
84
-
85
-
86
-
87
-
88
-
89
-
90
-
91
-
92
-
93
-
94
-
95
-
96
-
97
-
98
-
99
-
100
-
101
-
102
-
103
-
104
-
105
-
106
-
107
-
108
-
109
-
110
-
111
-
112
-
113
-
114
-
115
-
116
-
117
-
118
-
119
-
120
-
121
-
122
-
123
-
124
-
125
-
126
-
127
-
128
-
129
-
130
-
131
-
132
-
133
-
134
-
135
-
136
-
137
-
138
-
139
-
140
-
141
-
142
-
143
-
144
-
145
-
146
-
147
-
148
-
149
-
150
-
151
-
152
-
153
-
154
-
155
-
156
-
157
-
158
-
159
-
160
-
161
-
162
-
163
-
164
-
 165
165 -
 166
166 -
 167
167 -
 168
168 -
 169
169 -
 170
170 -
 171
171 -
 172
172 -
 173
173 -
 174
174 -
 175
175 -
 176
176 -
 177
177 -
 178
178 -
 179
179 -
 180
180 -
 181
181 -
 182
182 -
 183
183 -
 184
184 -
 185
185 -
186
-
187
-
188
-
189
-
190
-
191
-
192
-
193
-
194
-
195
-
196
-
197
-
198
-
199
-
200
-
201
-
202
-
203
-
204
-
205
-
206
-
207
-
208
-
209
-
210
-
211
-
212
-
213
-
214
-
215
-
216
-
217
-
218
-
219
-
220
-
221
-
222
-
223
-
224
-
225
-
226
-
227
-
228
-
229
-
230
-
231
-
232
-
233
-
234
-
235
-
236
-
237
-
238
-
239
-
240
-
241
-
242
-
243
-
244
-
245
-
246
-
247
-
248
-
249
-
250
-
251
-
252
-
253
-
254
-
255
-
256
-
257
-
258
-
259
-
260
-
261
-
262
-
263
-
264
-
265
-
266
-
267
-
268
-
269
-
270
-
271
-
272
-
273
-
274
-
275
-
276
-
277
-
278
-
279
-
280
-
281
-
282
-
283
-
284
-
285
-
286
-
287
-
288
-
289
-
290
-
291
-
292
-
293
-
294
-
295
 |
 |

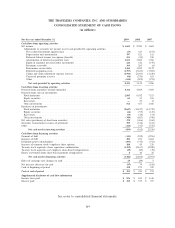
THE TRAVELERS COMPANIES, INC. AND SUBSIDIARIES
CONSOLIDATED STATEMENT OF CHANGES IN SHAREHOLDERS’ EQUITY
(in millions)
For the year ended December 31, 2009 2008 2007
Convertible preferred stock—savings plan
Balance, beginning of year .......................................... $89$ 112 $ 129
Redemptions during year ........................................... (10) (23) (17)
Balance, end of year .............................................. 79 89 112
Common stock
Balance, beginning of year .......................................... 19,242 18,990 18,530
Employee share-based compensation . . . . . . . . . . . . . . . . . . . . . . . . . . . . . . . . . . . 210 114 260
Compensation amortization under share-based plans and other changes . . . . . . . . . . . . . 141 138 164
Conversion of convertible notes....................................... ——36
Balance, end of year .............................................. 19,593 19,242 18,990
Retained earnings
Balance, beginning of year .......................................... 13,314 11,110 7,253
Cumulative effect of adoption of updated accounting guidance at April 1, 2009 (see
note 1) ..................................................... 71 ——
Net income .................................................... 3,622 2,924 4,601
Dividends ..................................................... (696) (715) (742)
Other........................................................ 4(5) (2)
Balance, end of year .............................................. 16,315 13,314 11,110
Accumulated other changes in equity from nonowner sources, net of tax
Balance, beginning of year .......................................... (900) 670 452
Cumulative effect of adoption of updated accounting guidance at April 1, 2009 (see
note 1) ..................................................... (71) ——
Change in net unrealized gain (loss) on investment securities:
Having no credit losses recognized in the consolidated statement of income . . . . . . . . 1,945 (764) 167
Having credit losses recognized in the consolidated statement of income . . . . . . . . . . 131 ——
Net change in benefit plan assets and obligations recognized in equity . . . . . . . . . . . . . . (88) (405) (50)
Net change in unrealized foreign currency translation and other changes . . . . . . . . . . . . 202 (401) 101
Balance, end of year .............................................. 1,219 (900) 670
Treasury stock (at cost)
Balance, beginning of year .......................................... (6,426) (4,266) (1,229)
Treasury shares acquired—share repurchase authorization . . . . . . . . . . . . . . . . . . . . . . (3,300) (2,122) (2,947)
Net shares acquired related to employee share-based compensation plans . . . . . . . . . . . (65) (38) (90)
Balance, end of year .............................................. (9,791) (6,426) (4,266)
Total common shareholders’ equity . . . . . . . . . . . . . . . . . . . . . . . . . . . . . . . . . . . 27,336 25,230 26,504
Total shareholders’ equity ......................................... $27,415 $25,319 $26,616
Common shares outstanding
Balance, beginning of year .......................................... 585.1 627.8 678.3
Treasury shares acquired—share repurchase authorization . . . . . . . . . . . . . . . . . . . . . . (69.4) (45.0) (56.0)
Net shares issued under employee share-based compensation plans . . . . . . . . . . . . . . . . 4.6 2.3 4.8
Shares issued pursuant to conversion of convertible notes . . . . . . . . . . . . . . . . . . . . . . —— 0.7
Balance, end of year .............................................. 520.3 585.1 627.8
Summary of changes in equity from nonowner sources
Net income .................................................... $ 3,622 $ 2,924 $ 4,601
Other changes in equity from nonowner sources, net of tax . . . . . . . . . . . . . . . . . . . . . 2,190 (1,570) 218
Total changes in equity from nonowner sources . . . . . . . . . . . . . . . . . . . . . . . . . . . . . $ 5,812 $ 1,354 $ 4,819
See notes to consolidated financial statements.
163