Travelers 2009 Annual Report Download - page 95
Download and view the complete annual report
Please find page 95 of the 2009 Travelers annual report below. You can navigate through the pages in the report by either clicking on the pages listed below, or by using the keyword search tool below to find specific information within the annual report.-
 1
1 -
2
-
3
-
4
-
5
-
6
-
7
-
8
-
9
-
10
-
11
-
12
-
13
-
14
-
15
-
16
-
17
-
18
-
19
-
20
-
21
-
22
-
23
-
24
-
25
-
26
-
27
-
28
-
29
-
30
-
31
-
32
-
33
-
34
-
35
-
36
-
37
-
38
-
39
-
40
-
41
-
42
-
43
-
44
-
45
-
46
-
47
-
48
-
49
-
50
-
51
-
52
-
53
-
54
-
55
-
56
-
57
-
58
-
59
-
60
-
61
-
62
-
63
-
64
-
65
-
66
-
67
-
68
-
69
-
70
-
71
-
72
-
73
-
74
-
75
-
76
-
77
-
78
-
79
-
80
-
81
-
82
-
83
-
84
-
 85
85 -
 86
86 -
 87
87 -
 88
88 -
 89
89 -
 90
90 -
 91
91 -
 92
92 -
 93
93 -
 94
94 -
 95
95 -
 96
96 -
 97
97 -
 98
98 -
 99
99 -
 100
100 -
 101
101 -
 102
102 -
 103
103 -
 104
104 -
 105
105 -
106
-
107
-
108
-
109
-
110
-
111
-
112
-
113
-
114
-
115
-
116
-
117
-
118
-
119
-
120
-
121
-
122
-
123
-
124
-
125
-
126
-
127
-
128
-
129
-
130
-
131
-
132
-
133
-
134
-
135
-
136
-
137
-
138
-
139
-
140
-
141
-
142
-
143
-
144
-
145
-
146
-
147
-
148
-
149
-
150
-
151
-
152
-
153
-
154
-
155
-
156
-
157
-
158
-
159
-
160
-
161
-
162
-
163
-
164
-
165
-
166
-
167
-
168
-
169
-
170
-
171
-
172
-
173
-
174
-
175
-
176
-
177
-
178
-
179
-
180
-
181
-
182
-
183
-
184
-
185
-
186
-
187
-
188
-
189
-
190
-
191
-
192
-
193
-
194
-
195
-
196
-
197
-
198
-
199
-
200
-
201
-
202
-
203
-
204
-
205
-
206
-
207
-
208
-
209
-
210
-
211
-
212
-
213
-
214
-
215
-
216
-
217
-
218
-
219
-
220
-
221
-
222
-
223
-
224
-
225
-
226
-
227
-
228
-
229
-
230
-
231
-
232
-
233
-
234
-
235
-
236
-
237
-
238
-
239
-
240
-
241
-
242
-
243
-
244
-
245
-
246
-
247
-
248
-
249
-
250
-
251
-
252
-
253
-
254
-
255
-
256
-
257
-
258
-
259
-
260
-
261
-
262
-
263
-
264
-
265
-
266
-
267
-
268
-
269
-
270
-
271
-
272
-
273
-
274
-
275
-
276
-
277
-
278
-
279
-
280
-
281
-
282
-
283
-
284
-
285
-
286
-
287
-
288
-
289
-
290
-
291
-
292
-
293
-
294
-
295
 |
 |
the Company’s implementation of the new fixed agent compensation program and the resolution of
various prior year tax matters.
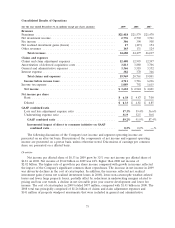
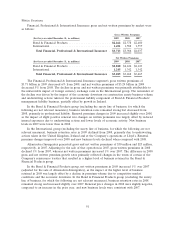
Earned Premiums
Earned premiums of $10.97 billion in 2009 decreased $212 million, or 2%, from 2008. The decline
in 2009 was primarily attributable to reduced insured exposures due to lower levels of economic
activity. Earned premiums of $11.18 billion in 2008 decreased $103 million, or 1%, from 2007,
reflecting the impact of competitive market conditions on pricing and new business.
Net Investment Income
Refer to the ‘‘Net Investment Income’’ section of ‘‘Consolidated Results of Operations’’ herein for
a discussion of the decline in the Company’s net investment income in 2009 and 2008 as compared with
the prior year.
Fee Income
National Accounts is the primary source of fee income due to its service businesses, which include
claim and loss prevention services to large companies that choose to self-insure a portion of their
insurance risks, as well as claims and policy management services to workers’ compensation residual
market pools. The $84 million decline in fee income in 2009 compared with 2008 primarily resulted
from lower serviced premium and claim volume due to the de-population of workers’ compensation
residual market pools, the impact on fee income related to both lower claim volume and lower loss
costs (as fees are based either on the number of claims serviced or as a percentage of losses) driven by
workers’ compensation reforms and overall lower claim frequency during the preceding twelve months.
Lower new business volume over the preceding twelve months, due to lower levels of economic activity
and increased competition, also contributed to the decline in fee income in 2009. In 2008, the
$118 million decline in fee income compared with 2007 primarily resulted from the same factors
causing the decline in 2009.
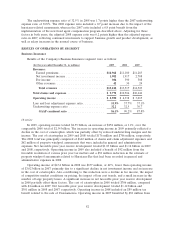
Claims and Expenses
Claims and claim adjustment expenses in 2009 totaled $6.04 billion, a decrease of $571 million, or
9%, compared with 2008. The decrease in 2009 primarily reflected a decline in the cost of catastrophes,
partially offset by the impact of loss cost trends and a slight decline in net favorable prior year reserve
development. The cost of catastrophes included in claims and claim adjustment expenses in 2009
totaled $176 million, compared with $642 million in 2008. Catastrophe losses in 2009 primarily resulted
from several wind and hail storms, as well as flooding. In 2008, Hurricanes Ike, Gustav and Dolly, and
other wind, rain and hail storms in several regions of the United States accounted for the majority of
catastrophe losses. Net favorable prior year reserve development in 2009 and 2008 totaled $1.03 billion
and $1.12 billion, respectively. The 2009 total was driven by better than expected loss results primarily
concentrated in the general liability, commercial multi-peril, commercial automobile and commercial
property product lines for recent accident years, reflecting greater reductions in frequency than the
Company expected based upon long-term frequency trends that have been declining. The general
liability and commercial multi-peril product lines experienced better than anticipated loss development
that was attributable to several factors, including improved legal and judicial environments, as well as
enhanced risk control, underwriting and claim process initiatives. The commercial automobile line of
business experienced better than expected loss development that was attributable to more favorable
legal and judicial environments, claim handling initiatives and improvements in auto safety technology.
The commercial property product line improvement primarily occurred in the 2007 and 2008 accident
years as a result of better than expected loss development for certain large national property and
inland marine exposures. In addition, the commercial property product line’s 2005 accident year
83