Travelers 2009 Annual Report Download - page 120
Download and view the complete annual report
Please find page 120 of the 2009 Travelers annual report below. You can navigate through the pages in the report by either clicking on the pages listed below, or by using the keyword search tool below to find specific information within the annual report.-
 1
1 -
2
-
3
-
4
-
5
-
6
-
7
-
8
-
9
-
10
-
11
-
12
-
13
-
14
-
15
-
16
-
17
-
18
-
19
-
20
-
21
-
22
-
23
-
24
-
25
-
26
-
27
-
28
-
29
-
30
-
31
-
32
-
33
-
34
-
35
-
36
-
37
-
38
-
39
-
40
-
41
-
42
-
43
-
44
-
45
-
46
-
47
-
48
-
49
-
50
-
51
-
52
-
53
-
54
-
55
-
56
-
57
-
58
-
59
-
60
-
61
-
62
-
63
-
64
-
65
-
66
-
67
-
68
-
69
-
70
-
71
-
72
-
73
-
74
-
75
-
76
-
77
-
78
-
79
-
80
-
81
-
82
-
83
-
84
-
85
-
86
-
87
-
88
-
89
-
90
-
91
-
92
-
93
-
94
-
95
-
96
-
97
-
98
-
99
-
100
-
101
-
102
-
103
-
104
-
105
-
106
-
107
-
108
-
109
-
 110
110 -
 111
111 -
 112
112 -
 113
113 -
 114
114 -
 115
115 -
 116
116 -
 117
117 -
 118
118 -
 119
119 -
 120
120 -
 121
121 -
 122
122 -
 123
123 -
 124
124 -
 125
125 -
 126
126 -
 127
127 -
 128
128 -
 129
129 -
 130
130 -
131
-
132
-
133
-
134
-
135
-
136
-
137
-
138
-
139
-
140
-
141
-
142
-
143
-
144
-
145
-
146
-
147
-
148
-
149
-
150
-
151
-
152
-
153
-
154
-
155
-
156
-
157
-
158
-
159
-
160
-
161
-
162
-
163
-
164
-
165
-
166
-
167
-
168
-
169
-
170
-
171
-
172
-
173
-
174
-
175
-
176
-
177
-
178
-
179
-
180
-
181
-
182
-
183
-
184
-
185
-
186
-
187
-
188
-
189
-
190
-
191
-
192
-
193
-
194
-
195
-
196
-
197
-
198
-
199
-
200
-
201
-
202
-
203
-
204
-
205
-
206
-
207
-
208
-
209
-
210
-
211
-
212
-
213
-
214
-
215
-
216
-
217
-
218
-
219
-
220
-
221
-
222
-
223
-
224
-
225
-
226
-
227
-
228
-
229
-
230
-
231
-
232
-
233
-
234
-
235
-
236
-
237
-
238
-
239
-
240
-
241
-
242
-
243
-
244
-
245
-
246
-
247
-
248
-
249
-
250
-
251
-
252
-
253
-
254
-
255
-
256
-
257
-
258
-
259
-
260
-
261
-
262
-
263
-
264
-
265
-
266
-
267
-
268
-
269
-
270
-
271
-
272
-
273
-
274
-
275
-
276
-
277
-
278
-
279
-
280
-
281
-
282
-
283
-
284
-
285
-
286
-
287
-
288
-
289
-
290
-
291
-
292
-
293
-
294
-
295
 |
 |

Borrowers of these securities provide collateral equal to at least 102% of the market value of the
loaned securities plus accrued interest. This collateral is held by a third-party custodian, and the
Company has the right to access the collateral only in the event that the institution borrowing the
Company’s securities is in default under the lending agreement. Therefore, the Company does not
recognize the receipt of the collateral held by the third-party custodian or the obligation to return the
collateral. The loaned securities remain a recorded asset of the Company. The Company accepts only
cash as collateral for securities on loan and restricts the manner in which that cash is invested. At
December 31, 2009 and 2008, the Company had $90 million and $8 million, respectively, of securities
on loan to others. The Company has not incurred any investment losses in its securities lending
program for the years ended December 31, 2009, 2008 and 2007.
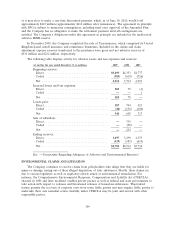
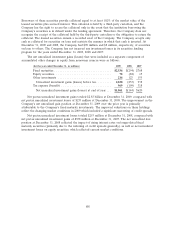
The net unrealized investment gains (losses) that were included as a separate component of
accumulated other changes in equity from nonowner sources were as follows:
(for the year ended December 31, in millions) 2009 2008 2007
Fixed maturities................................. $2,536 $(294) $768
Equity securities................................. 78 (82) 15
Other investments ............................... 216 123 155
Unrealized investment gains (losses) before tax . . . . . . . . . 2,830 (253) 938
Tax expense (benefit) ............................. 969 (109) 318
Net unrealized investment gains (losses) at end of year . . . $1,861 $(144) $620
Net pretax unrealized investment gains totaled $2.83 billion at December 31, 2009, compared with
net pretax unrealized investment losses of $253 million at December 31, 2008. The improvement in the
Company’s net unrealized gain position at December 31, 2009 over the prior year is primarily
attributable to the Company’s fixed maturity investments. The improved valuations on these holdings
reflect the changing market conditions in 2009 which included a significant narrowing of credit spreads.
Net pretax unrealized investment losses totaled $253 million at December 31, 2008, compared with
net pretax unrealized investment gains of $938 million at December 31, 2007. The net unrealized loss
position at December 31, 2008 reflected the impact of rising interest rates on longer-dated fixed
maturity securities (primarily due to the widening of credit spreads generally), as well as net unrealized
investment losses on equity securities, which reflected current market conditions.
108