Travelers 2009 Annual Report Download - page 135
Download and view the complete annual report
Please find page 135 of the 2009 Travelers annual report below. You can navigate through the pages in the report by either clicking on the pages listed below, or by using the keyword search tool below to find specific information within the annual report.-
 1
1 -
2
-
3
-
4
-
5
-
6
-
7
-
8
-
9
-
10
-
11
-
12
-
13
-
14
-
15
-
16
-
17
-
18
-
19
-
20
-
21
-
22
-
23
-
24
-
25
-
26
-
27
-
28
-
29
-
30
-
31
-
32
-
33
-
34
-
35
-
36
-
37
-
38
-
39
-
40
-
41
-
42
-
43
-
44
-
45
-
46
-
47
-
48
-
49
-
50
-
51
-
52
-
53
-
54
-
55
-
56
-
57
-
58
-
59
-
60
-
61
-
62
-
63
-
64
-
65
-
66
-
67
-
68
-
69
-
70
-
71
-
72
-
73
-
74
-
75
-
76
-
77
-
78
-
79
-
80
-
81
-
82
-
83
-
84
-
85
-
86
-
87
-
88
-
89
-
90
-
91
-
92
-
93
-
94
-
95
-
96
-
97
-
98
-
99
-
100
-
101
-
102
-
103
-
104
-
105
-
106
-
107
-
108
-
109
-
110
-
111
-
112
-
113
-
114
-
115
-
116
-
117
-
118
-
119
-
120
-
121
-
122
-
123
-
124
-
 125
125 -
 126
126 -
 127
127 -
 128
128 -
 129
129 -
 130
130 -
 131
131 -
 132
132 -
 133
133 -
 134
134 -
 135
135 -
 136
136 -
 137
137 -
 138
138 -
 139
139 -
 140
140 -
 141
141 -
 142
142 -
 143
143 -
 144
144 -
 145
145 -
146
-
147
-
148
-
149
-
150
-
151
-
152
-
153
-
154
-
155
-
156
-
157
-
158
-
159
-
160
-
161
-
162
-
163
-
164
-
165
-
166
-
167
-
168
-
169
-
170
-
171
-
172
-
173
-
174
-
175
-
176
-
177
-
178
-
179
-
180
-
181
-
182
-
183
-
184
-
185
-
186
-
187
-
188
-
189
-
190
-
191
-
192
-
193
-
194
-
195
-
196
-
197
-
198
-
199
-
200
-
201
-
202
-
203
-
204
-
205
-
206
-
207
-
208
-
209
-
210
-
211
-
212
-
213
-
214
-
215
-
216
-
217
-
218
-
219
-
220
-
221
-
222
-
223
-
224
-
225
-
226
-
227
-
228
-
229
-
230
-
231
-
232
-
233
-
234
-
235
-
236
-
237
-
238
-
239
-
240
-
241
-
242
-
243
-
244
-
245
-
246
-
247
-
248
-
249
-
250
-
251
-
252
-
253
-
254
-
255
-
256
-
257
-
258
-
259
-
260
-
261
-
262
-
263
-
264
-
265
-
266
-
267
-
268
-
269
-
270
-
271
-
272
-
273
-
274
-
275
-
276
-
277
-
278
-
279
-
280
-
281
-
282
-
283
-
284
-
285
-
286
-
287
-
288
-
289
-
290
-
291
-
292
-
293
-
294
-
295
 |
 |

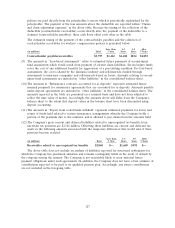
The following table provides a reconciliation of total capitalization excluding net unrealized gain
(loss) on investments to total capitalization presented in the foregoing table.
(at December 31, dollars in millions) 2009 2008
Total capitalization excluding net unrealized gain (loss) on investments . . . . . . . . . $32,081 $31,644
Net unrealized gain (loss) on investments, net of taxes . . . . . . . . . . . . . . . . . . . . . 1,861 (144)
Total capitalization.............................................. $33,942 $31,500
Debt-to-total capital ratio......................................... 19.2% 19.6%
Debt-to-total capital ratio excluding net unrealized gain (loss) on investments . . . 20.3% 19.5%
The debt-to-total capital ratio excluding net unrealized gain (loss) on investments is calculated by
dividing (a) debt by (b) total capitalization excluding net unrealized investment gain (loss) on
investments, net of taxes. Net unrealized investment gains and losses can be significantly impacted by
both discretionary and other economic factors and are not necessarily indicative of operating trends.
Accordingly, in the opinion of the Company’s management, the debt-to-total capital ratio calculated on
this basis provides another useful metric for investors to understand the Company’s financial leverage
position. The Company’s debt-to-total capital ratio of 20.3% at December 31, 2009 calculated on this
basis approximated its targeted level.
Line of Credit Agreement. The Company has a $1.0 billion, five-year revolving credit agreement
(the ‘‘credit agreement’’) with a syndicate of financial institutions that expires on June 10, 2010.
Pursuant to covenants in the credit agreement, the Company must maintain an excess of consolidated
net worth over goodwill and other intangible assets of not less than $10 billion at all times. The
Company must also maintain a ratio of total consolidated debt to the sum of total consolidated debt
plus consolidated net worth of not greater than 0.40 to 1.00. In addition, the credit agreement contains
other customary restrictive covenants as well as certain customary events of default, including with
respect to a change in control. At December 31, 2009, the Company was in compliance with these
covenants and all other covenants related to its outstanding debt instruments. There was no amount
outstanding under the credit agreement as of December 31, 2009. The Company is evaluating its
options with regard to the forthcoming expiration of the credit agreement. The credit agreement
provides back-up liquidity for the Company’s $800 million commercial paper program, of which
$100 million was outstanding at December 31, 2009.
In December 2008, the Company filed with the Securities and Exchange Commission a universal
shelf registration statement for the potential offering and sale of securities to replace its expiring
universal shelf registration statement. The Company may offer these securities from time to time at
prices and on other terms to be determined at the time of offering. During 2009, the Company issued
securities with a principal amount of $500 million under the new shelf registration statement, and in
2008, the Company issued securities with a principal amount of $500 million under the prior shelf
registration statement.
Share Repurchase Authorization. At December 31, 2009, the Company had $6.51 billion of
capacity remaining under its share repurchase authorization approved by the board of directors.
Contractual Obligations
The following table summarizes, as of December 31, 2009, the Company’s future payments under
contractual obligations and estimated claims and claims related payments. The table excludes
short-term obligations and includes only liabilities at December 31, 2009 that are expected to be settled
in cash.
123