Travelers 2009 Annual Report Download - page 116
Download and view the complete annual report
Please find page 116 of the 2009 Travelers annual report below. You can navigate through the pages in the report by either clicking on the pages listed below, or by using the keyword search tool below to find specific information within the annual report.-
 1
1 -
2
-
3
-
4
-
5
-
6
-
7
-
8
-
9
-
10
-
11
-
12
-
13
-
14
-
15
-
16
-
17
-
18
-
19
-
20
-
21
-
22
-
23
-
24
-
25
-
26
-
27
-
28
-
29
-
30
-
31
-
32
-
33
-
34
-
35
-
36
-
37
-
38
-
39
-
40
-
41
-
42
-
43
-
44
-
45
-
46
-
47
-
48
-
49
-
50
-
51
-
52
-
53
-
54
-
55
-
56
-
57
-
58
-
59
-
60
-
61
-
62
-
63
-
64
-
65
-
66
-
67
-
68
-
69
-
70
-
71
-
72
-
73
-
74
-
75
-
76
-
77
-
78
-
79
-
80
-
81
-
82
-
83
-
84
-
85
-
86
-
87
-
88
-
89
-
90
-
91
-
92
-
93
-
94
-
95
-
96
-
97
-
98
-
99
-
100
-
101
-
102
-
103
-
104
-
105
-
 106
106 -
 107
107 -
 108
108 -
 109
109 -
 110
110 -
 111
111 -
 112
112 -
 113
113 -
 114
114 -
 115
115 -
 116
116 -
 117
117 -
 118
118 -
 119
119 -
 120
120 -
 121
121 -
 122
122 -
 123
123 -
 124
124 -
 125
125 -
 126
126 -
127
-
128
-
129
-
130
-
131
-
132
-
133
-
134
-
135
-
136
-
137
-
138
-
139
-
140
-
141
-
142
-
143
-
144
-
145
-
146
-
147
-
148
-
149
-
150
-
151
-
152
-
153
-
154
-
155
-
156
-
157
-
158
-
159
-
160
-
161
-
162
-
163
-
164
-
165
-
166
-
167
-
168
-
169
-
170
-
171
-
172
-
173
-
174
-
175
-
176
-
177
-
178
-
179
-
180
-
181
-
182
-
183
-
184
-
185
-
186
-
187
-
188
-
189
-
190
-
191
-
192
-
193
-
194
-
195
-
196
-
197
-
198
-
199
-
200
-
201
-
202
-
203
-
204
-
205
-
206
-
207
-
208
-
209
-
210
-
211
-
212
-
213
-
214
-
215
-
216
-
217
-
218
-
219
-
220
-
221
-
222
-
223
-
224
-
225
-
226
-
227
-
228
-
229
-
230
-
231
-
232
-
233
-
234
-
235
-
236
-
237
-
238
-
239
-
240
-
241
-
242
-
243
-
244
-
245
-
246
-
247
-
248
-
249
-
250
-
251
-
252
-
253
-
254
-
255
-
256
-
257
-
258
-
259
-
260
-
261
-
262
-
263
-
264
-
265
-
266
-
267
-
268
-
269
-
270
-
271
-
272
-
273
-
274
-
275
-
276
-
277
-
278
-
279
-
280
-
281
-
282
-
283
-
284
-
285
-
286
-
287
-
288
-
289
-
290
-
291
-
292
-
293
-
294
-
295
 |
 |

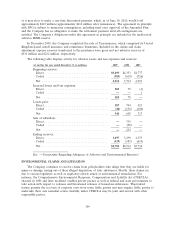
particularly the case with policyholders in bankruptcy where negotiations often involve a large number
of claimants and other parties and require court approval to be effective. As part of its continuing
analysis of asbestos and environmental reserves, the Company continues to study the implications of
these and other developments. (Also, see ‘‘Part I—Item 3, Legal Proceedings’’).
Because of the uncertainties set forth above, additional liabilities may arise for amounts in excess
of the current related reserves. In addition, the Company’s estimate of claims and claim adjustment
expenses may change. These additional liabilities or increases in estimates, or a range of either, cannot
now be reasonably estimated and could result in income statement charges that could be material to
the Company’s operating results in future periods.
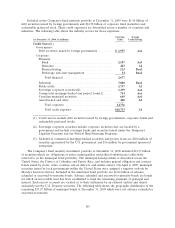
INVESTMENT PORTFOLIO
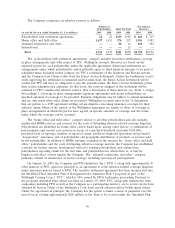
The Company’s invested assets at December 31, 2009 totaled $74.97 billion, of which 94% was
invested in fixed maturity and short-term investments, 1% in equity securities, 1% in real estate and
4% in other investments. Because the primary purpose of the investment portfolio is to fund future
claims payments, the Company employs a conservative investment philosophy. A significant majority of
funds available for investment are deployed in a widely diversified portfolio of high quality, liquid
taxable U.S. government, tax-exempt U.S. municipal bonds, and taxable corporate and U.S. agency
mortgage-backed bonds.
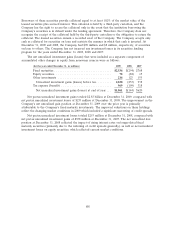
The Company’s fixed maturity portfolio at December 31, 2009 totaled $65.85 billion. The Company
closely monitors the duration of its fixed maturity investments, and investment purchases and sales are
executed with the objective of having adequate funds available to satisfy the Company’s insurance and
debt obligations. The weighted average credit quality of the Company’s fixed maturity portfolio, both
including and excluding U.S. Treasury securities, was ‘‘Aa2’’ at December 31, 2009 and ‘‘Aa1’’ at
December 31, 2008. The slight decline in the Company’s average credit quality rating was due to the
downgrading of a monoline bond insurer during the second quarter of 2009 and the downgrading of
non-agency mortgage-backed securities. Below investment grade securities represented 2.7% and 2.0%
of the total fixed maturity investment portfolio at December 31, 2009 and 2008, respectively. The
downgrading of non-agency mortgage backed securities and an increase in the fair value of those and
other below investment grade securities also resulted in an increase to our below investment grade
securities. The average effective duration of fixed maturities and short-term securities was 3.9 (4.2
excluding short-term securities) at December 31, 2009 and 4.2 (4.6 excluding short-term securities) at
December 31, 2008. The decline in duration resulted from the impact of declining market yields on
existing holdings of municipal bonds and mortgage-backed securities (which impact the assumptions
related to optional pre-payments and the related estimate of effective duration for callable securities),
and the purchase of shorter-term fixed maturities during the second half of 2009.
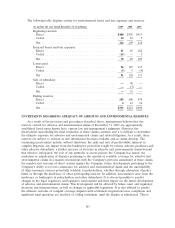
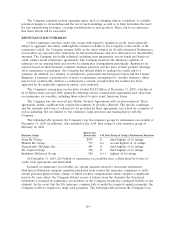
The following table sets forth the Company’s combined fixed maturity investment portfolio rated
using external ratings agencies or by the Company when a public rating does not exist:
Carrying Percent of Total
(at December 31, 2009, in millions) Value Carrying Value
Quality Rating:
Aaa ....................................... $28,093 42.7%
Aa ........................................ 24,861 37.8
A......................................... 7,000 10.6
Baa ....................................... 4,091 6.2
Total investment grade.......................... 64,045 97.3
Below investment grade......................... 1,802 2.7
Total fixed maturity investments . . . . . . . . . . . . . . . . . . . $65,847 100.0%
104