Travelers 2009 Annual Report Download - page 202
Download and view the complete annual report
Please find page 202 of the 2009 Travelers annual report below. You can navigate through the pages in the report by either clicking on the pages listed below, or by using the keyword search tool below to find specific information within the annual report.-
 1
1 -
2
-
3
-
4
-
5
-
6
-
7
-
8
-
9
-
10
-
11
-
12
-
13
-
14
-
15
-
16
-
17
-
18
-
19
-
20
-
21
-
22
-
23
-
24
-
25
-
26
-
27
-
28
-
29
-
30
-
31
-
32
-
33
-
34
-
35
-
36
-
37
-
38
-
39
-
40
-
41
-
42
-
43
-
44
-
45
-
46
-
47
-
48
-
49
-
50
-
51
-
52
-
53
-
54
-
55
-
56
-
57
-
58
-
59
-
60
-
61
-
62
-
63
-
64
-
65
-
66
-
67
-
68
-
69
-
70
-
71
-
72
-
73
-
74
-
75
-
76
-
77
-
78
-
79
-
80
-
81
-
82
-
83
-
84
-
85
-
86
-
87
-
88
-
89
-
90
-
91
-
92
-
93
-
94
-
95
-
96
-
97
-
98
-
99
-
100
-
101
-
102
-
103
-
104
-
105
-
106
-
107
-
108
-
109
-
110
-
111
-
112
-
113
-
114
-
115
-
116
-
117
-
118
-
119
-
120
-
121
-
122
-
123
-
124
-
125
-
126
-
127
-
128
-
129
-
130
-
131
-
132
-
133
-
134
-
135
-
136
-
137
-
138
-
139
-
140
-
141
-
142
-
143
-
144
-
145
-
146
-
147
-
148
-
149
-
150
-
151
-
152
-
153
-
154
-
155
-
156
-
157
-
158
-
159
-
160
-
161
-
162
-
163
-
164
-
165
-
166
-
167
-
168
-
169
-
170
-
171
-
172
-
173
-
174
-
175
-
176
-
177
-
178
-
179
-
180
-
181
-
182
-
183
-
184
-
185
-
186
-
187
-
188
-
189
-
190
-
191
-
 192
192 -
 193
193 -
 194
194 -
 195
195 -
 196
196 -
 197
197 -
 198
198 -
 199
199 -
 200
200 -
 201
201 -
 202
202 -
 203
203 -
 204
204 -
 205
205 -
 206
206 -
 207
207 -
 208
208 -
 209
209 -
 210
210 -
 211
211 -
 212
212 -
213
-
214
-
215
-
216
-
217
-
218
-
219
-
220
-
221
-
222
-
223
-
224
-
225
-
226
-
227
-
228
-
229
-
230
-
231
-
232
-
233
-
234
-
235
-
236
-
237
-
238
-
239
-
240
-
241
-
242
-
243
-
244
-
245
-
246
-
247
-
248
-
249
-
250
-
251
-
252
-
253
-
254
-
255
-
256
-
257
-
258
-
259
-
260
-
261
-
262
-
263
-
264
-
265
-
266
-
267
-
268
-
269
-
270
-
271
-
272
-
273
-
274
-
275
-
276
-
277
-
278
-
279
-
280
-
281
-
282
-
283
-
284
-
285
-
286
-
287
-
288
-
289
-
290
-
291
-
292
-
293
-
294
-
295
 |
 |

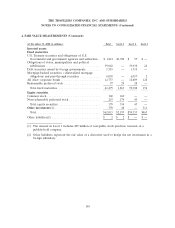
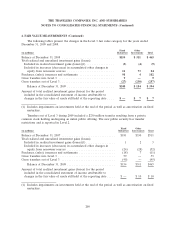
THE TRAVELERS COMPANIES, INC. AND SUBSIDIARIES
NOTES TO CONSOLIDATED FINANCIAL STATEMENTS (Continued)
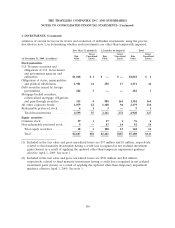
3. INVESTMENTS (Continued)
estimates of several factors in its review and evaluation of individual investments, using the process
described in note 1, in determining whether such investments are other-than-temporarily impaired.
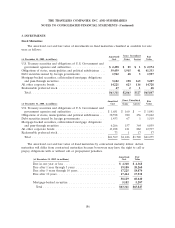
Less than 12 months(1) 12 months or longer(2) Total
Gross Gross Gross
Fair Unrealized Fair Unrealized Fair Unrealized
(at December 31, 2009, in millions) Value Losses Value Losses Value Losses
Fixed maturities
U.S. Treasury securities and
obligations of U.S. Government
and government agencies and
authorities.................. $1,018 $ 1 $ — $ — $1,018 $ 1
Obligations of states, municipalities
and political subdivisions . . . . . . . 1,901 24 250 17 2,151 41
Debt securities issued by foreign
governments ................ 282 3 — — 282 3
Mortgage-backed securities,
collateralized mortgage obligations
and pass-through securities . . . . . . 313 4 988 161 1,301 165
All other corporate bonds . . . . . . . . 1,079 22 1,100 94 2,179 116
Redeemable preferred stock . . . . . . . 61 3— 9 1
Total fixed maturities . . . . . . . . . . 4,599 55 2,341 272 6,940 327
Equity securities
Common stock ................ 59 1 17 1 76 2
Non-redeemable preferred stock . . . . 9 — 83 14 92 14
Total equity securities . . . . . . . . . . 68 1 100 15 168 16
Total...................... $4,667 $56 $2,441 $287 $7,108 $343
(1) Included in the fair value and gross unrealized losses are $37 million and $1 million, respectively,
related to fixed maturity investments having a credit loss recognized in net realized investment
gains (losses) as a result of applying the updated other-than-temporary impairment guidance
effective April 1, 2009. See note 1.
(2) Included in the fair value and gross unrealized losses are $521 million and $62 million,
respectively, related to fixed maturity investments having a credit loss recognized in net realized
investment gains (losses) as a result of applying the updated other-than-temporary impairment
guidance effective April 1, 2009. See note 1.
190