Travelers 2009 Annual Report Download - page 85
Download and view the complete annual report
Please find page 85 of the 2009 Travelers annual report below. You can navigate through the pages in the report by either clicking on the pages listed below, or by using the keyword search tool below to find specific information within the annual report.-
 1
1 -
2
-
3
-
4
-
5
-
6
-
7
-
8
-
9
-
10
-
11
-
12
-
13
-
14
-
15
-
16
-
17
-
18
-
19
-
20
-
21
-
22
-
23
-
24
-
25
-
26
-
27
-
28
-
29
-
30
-
31
-
32
-
33
-
34
-
35
-
36
-
37
-
38
-
39
-
40
-
41
-
42
-
43
-
44
-
45
-
46
-
47
-
48
-
49
-
50
-
51
-
52
-
53
-
54
-
55
-
56
-
57
-
58
-
59
-
60
-
61
-
62
-
63
-
64
-
65
-
66
-
67
-
68
-
69
-
70
-
71
-
72
-
73
-
74
-
 75
75 -
 76
76 -
 77
77 -
 78
78 -
 79
79 -
 80
80 -
 81
81 -
 82
82 -
 83
83 -
 84
84 -
 85
85 -
 86
86 -
 87
87 -
 88
88 -
 89
89 -
 90
90 -
 91
91 -
 92
92 -
 93
93 -
 94
94 -
 95
95 -
96
-
97
-
98
-
99
-
100
-
101
-
102
-
103
-
104
-
105
-
106
-
107
-
108
-
109
-
110
-
111
-
112
-
113
-
114
-
115
-
116
-
117
-
118
-
119
-
120
-
121
-
122
-
123
-
124
-
125
-
126
-
127
-
128
-
129
-
130
-
131
-
132
-
133
-
134
-
135
-
136
-
137
-
138
-
139
-
140
-
141
-
142
-
143
-
144
-
145
-
146
-
147
-
148
-
149
-
150
-
151
-
152
-
153
-
154
-
155
-
156
-
157
-
158
-
159
-
160
-
161
-
162
-
163
-
164
-
165
-
166
-
167
-
168
-
169
-
170
-
171
-
172
-
173
-
174
-
175
-
176
-
177
-
178
-
179
-
180
-
181
-
182
-
183
-
184
-
185
-
186
-
187
-
188
-
189
-
190
-
191
-
192
-
193
-
194
-
195
-
196
-
197
-
198
-
199
-
200
-
201
-
202
-
203
-
204
-
205
-
206
-
207
-
208
-
209
-
210
-
211
-
212
-
213
-
214
-
215
-
216
-
217
-
218
-
219
-
220
-
221
-
222
-
223
-
224
-
225
-
226
-
227
-
228
-
229
-
230
-
231
-
232
-
233
-
234
-
235
-
236
-
237
-
238
-
239
-
240
-
241
-
242
-
243
-
244
-
245
-
246
-
247
-
248
-
249
-
250
-
251
-
252
-
253
-
254
-
255
-
256
-
257
-
258
-
259
-
260
-
261
-
262
-
263
-
264
-
265
-
266
-
267
-
268
-
269
-
270
-
271
-
272
-
273
-
274
-
275
-
276
-
277
-
278
-
279
-
280
-
281
-
282
-
283
-
284
-
285
-
286
-
287
-
288
-
289
-
290
-
291
-
292
-
293
-
294
-
295
 |
 |

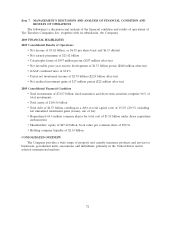
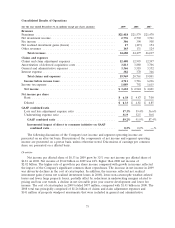
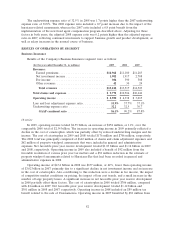
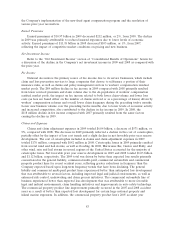
Consolidated Results of Operations
(for the year ended December 31, in millions except per share amounts) 2009 2008 2007
Revenues
Premiums .............................................. $21,418 $21,579 $21,470
Net investment income..................................... 2,776 2,792 3,761
Fee income ............................................. 306 390 508
Net realized investment gains (losses) . . . . . . . . . . . . . . . . . . . . . . . . . . 17 (415) 154
Other revenues .......................................... 163 131 124
Total revenues ........................................ 24,680 24,477 26,017
Claims and expenses
Claims and claim adjustment expenses . . . . . . . . . . . . . . . . . . . . . . . . . . 12,408 12,993 12,397
Amortization of deferred acquisition costs . . . . . . . . . . . . . . . . . . . . . . . 3,813 3,880 3,706
General and administrative expenses . . . . . . . . . . . . . . . . . . . . . . . . . . . 3,366 3,518 3,352
Interest expense.......................................... 382 370 346
Total claims and expenses ............................... 19,969 20,761 19,801
Income before income taxes ................................ 4,711 3,716 6,216
Income tax expense ....................................... 1,089 792 1,615
Net income ............................................ $ 3,622 $ 2,924 $ 4,601
Net income per share
Basic ................................................ $ 6.38 $ 4.87 $ 7.00
Diluted .............................................. $ 6.33 $ 4.81 $ 6.85
GAAP combined ratio
Loss and loss adjustment expense ratio . . . . . . . . . . . . . . . . . . . . . . . 57.3% 59.4% 56.6%
Underwriting expense ratio ................................ 31.9 32.5 30.8
GAAP combined ratio .................................. 89.2% 91.9% 87.4%
Incremental impact of direct to consumer initiative on GAAP
combined ratio ...................................... 0.5% 0.2% —%
The following discussions of the Company’s net income and segment operating income are
presented on an after-tax basis. Discussions of the components of net income and segment operating
income are presented on a pretax basis, unless otherwise noted. Discussions of earnings per common
share are presented on a diluted basis.
Overview
Net income per diluted share of $6.33 in 2009 grew by 32% over net income per diluted share of
$4.81 on 2008. Net income of $3.62 billion in 2009 was 24% higher than 2008 net income of
$2.92 billion. The higher rate of growth in per share income compared with growth in income reflected
the impact of the Company’s significant common share repurchases. The increase in net income in 2009
was driven by declines in the cost of catastrophes. In addition, the increase reflected net realized
investment gains (versus net realized investment losses in 2008), lower non-catastrophe weather-related
losses and fewer large property losses, partially offset by reductions in underwriting margins related to
pricing and loss cost trends, a decline in net favorable prior year reserve development and lower fee
income. The cost of catastrophes in 2009 totaled $457 million, compared with $1.41 billion in 2008. The
2008 total was principally comprised of $1.26 billion of claims and claim adjustment expenses and
$141 million of property windpool assessments that were included in general and administrative
73