Travelers 2009 Annual Report Download - page 91
Download and view the complete annual report
Please find page 91 of the 2009 Travelers annual report below. You can navigate through the pages in the report by either clicking on the pages listed below, or by using the keyword search tool below to find specific information within the annual report.-
 1
1 -
2
-
3
-
4
-
5
-
6
-
7
-
8
-
9
-
10
-
11
-
12
-
13
-
14
-
15
-
16
-
17
-
18
-
19
-
20
-
21
-
22
-
23
-
24
-
25
-
26
-
27
-
28
-
29
-
30
-
31
-
32
-
33
-
34
-
35
-
36
-
37
-
38
-
39
-
40
-
41
-
42
-
43
-
44
-
45
-
46
-
47
-
48
-
49
-
50
-
51
-
52
-
53
-
54
-
55
-
56
-
57
-
58
-
59
-
60
-
61
-
62
-
63
-
64
-
65
-
66
-
67
-
68
-
69
-
70
-
71
-
72
-
73
-
74
-
75
-
76
-
77
-
78
-
79
-
80
-
 81
81 -
 82
82 -
 83
83 -
 84
84 -
 85
85 -
 86
86 -
 87
87 -
 88
88 -
 89
89 -
 90
90 -
 91
91 -
 92
92 -
 93
93 -
 94
94 -
 95
95 -
 96
96 -
 97
97 -
 98
98 -
 99
99 -
 100
100 -
 101
101 -
102
-
103
-
104
-
105
-
106
-
107
-
108
-
109
-
110
-
111
-
112
-
113
-
114
-
115
-
116
-
117
-
118
-
119
-
120
-
121
-
122
-
123
-
124
-
125
-
126
-
127
-
128
-
129
-
130
-
131
-
132
-
133
-
134
-
135
-
136
-
137
-
138
-
139
-
140
-
141
-
142
-
143
-
144
-
145
-
146
-
147
-
148
-
149
-
150
-
151
-
152
-
153
-
154
-
155
-
156
-
157
-
158
-
159
-
160
-
161
-
162
-
163
-
164
-
165
-
166
-
167
-
168
-
169
-
170
-
171
-
172
-
173
-
174
-
175
-
176
-
177
-
178
-
179
-
180
-
181
-
182
-
183
-
184
-
185
-
186
-
187
-
188
-
189
-
190
-
191
-
192
-
193
-
194
-
195
-
196
-
197
-
198
-
199
-
200
-
201
-
202
-
203
-
204
-
205
-
206
-
207
-
208
-
209
-
210
-
211
-
212
-
213
-
214
-
215
-
216
-
217
-
218
-
219
-
220
-
221
-
222
-
223
-
224
-
225
-
226
-
227
-
228
-
229
-
230
-
231
-
232
-
233
-
234
-
235
-
236
-
237
-
238
-
239
-
240
-
241
-
242
-
243
-
244
-
245
-
246
-
247
-
248
-
249
-
250
-
251
-
252
-
253
-
254
-
255
-
256
-
257
-
258
-
259
-
260
-
261
-
262
-
263
-
264
-
265
-
266
-
267
-
268
-
269
-
270
-
271
-
272
-
273
-
274
-
275
-
276
-
277
-
278
-
279
-
280
-
281
-
282
-
283
-
284
-
285
-
286
-
287
-
288
-
289
-
290
-
291
-
292
-
293
-
294
-
295
 |
 |
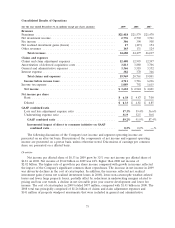
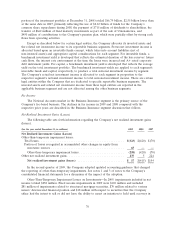
Claims and Expenses
Claims and Claim Adjustment Expenses
Claims and claim adjustment expenses totaled $12.41 billion in 2009, $585 million, or 5%, lower
than the 2008 total of $12.99 billion, primarily reflecting a decline in the cost of catastrophes, lower
non-catastrophe weather-related losses and fewer large property losses, mostly offset by a decline in net
favorable prior year reserve development and the impact of loss cost trends. Total claims and claim
adjustment expenses in 2009 included $457 million for the cost of catastrophes and $1.33 billion of net
favorable prior year reserve development, whereas the comparable 2008 total included $1.26 billion for
the cost of catastrophes and $1.54 billion of net favorable prior year reserve development. Catastrophe
losses in 2009 primarily resulted from several wind and hail storms, as well as flooding. Catastrophe
losses in 2008 primarily resulted from Hurricanes Ike, Gustav and Dolly.
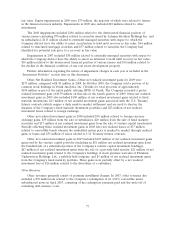
Claims and claim adjustment expenses totaled $12.99 billion in 2008, $596 million, or 5%, higher
than the 2007 total of $12.40 billion, primarily reflecting a significant increase in the cost of
catastrophes, an increase in the number of large losses that exceeded expectations, an increase in
non-catastrophe related weather losses in Personal Insurance and the impact of loss cost trends. These
factors were partially offset by an increase in net favorable prior year reserve development. The cost of
catastrophes included in claims and claim adjustment expenses in 2008 totaled $1.26 billion, primarily
resulting from Hurricanes Ike and Gustav, as well as wind, rain and hail storms in several regions of
the United States throughout the year. The cost of catastrophes in 2007 totaled $167 million, primarily
resulting from wildfires in California and several wind, rain and hail storms throughout the United
States. Net favorable prior year reserve development in 2008 totaled $1.54 billion, compared with
$546 million of net favorable prior year reserve development in 2007.
Net favorable prior year reserve development of $1.33 billion in 2009 reflected greater reductions
in frequency than the Company expected based upon long-term frequency trends that have been
declining. In the Business Insurance segment, net favorable prior year reserve development of
$1.03 billion resulted from better than expected loss development for recent accident years in the
general liability, commercial multi-peril, commercial automobile and commercial property product lines,
partially offset by increases to asbestos and environmental reserves of $185 million and $70 million,
respectively (which are discussed in more detail in the ‘‘Asbestos Claims and Litigation’’ and
‘‘Environmental Claims and Litigation’’ sections herein). Net favorable prior year reserve development
in the Financial, Professional & International Insurance segment totaled $168 million, driven by better
than expected loss experience in the International group—particularly in the United Kingdom, several
lines of business at Lloyd’s and in the surety line of business in Canada—and in the contract surety line
of business in the Bond & Financial Products group. In the Personal Insurance segment, net favorable
prior year reserve development of $135 million was driven by better than expected loss experience
related to Hurricanes Katrina and Ike and the 2007 California wildfires.
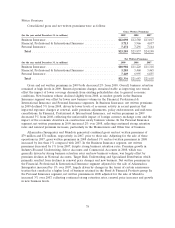
The Company’s three business segments each experienced net favorable prior year reserve
development in 2008. Net favorable prior year reserve development of $1.12 billion in the Business
Insurance segment was driven by better than expected loss results primarily concentrated in the general
liability, commercial multi-peril, commercial property and commercial automobile product lines,
partially offset by increases in workers’ compensation reserves and $70 million and $85 million
increases in asbestos and environmental reserves, respectively. In the Financial, Professional &
International Insurance segment, net favorable prior year reserve development of $274 million was
concentrated in the International group, particularly in the public and products liability (general
liability), professional indemnity (professional liability) and property lines of business in the United
Kingdom, the general liability line of business in Canada, and the Aviation and Property lines of
business at Lloyd’s. In the Personal Insurance segment, net favorable prior year reserve development of
$143 million in 2008 was primarily driven by favorable loss experience related to Hurricane Katrina as
79