Travelers 2009 Annual Report Download - page 110
Download and view the complete annual report
Please find page 110 of the 2009 Travelers annual report below. You can navigate through the pages in the report by either clicking on the pages listed below, or by using the keyword search tool below to find specific information within the annual report.-
 1
1 -
2
-
3
-
4
-
5
-
6
-
7
-
8
-
9
-
10
-
11
-
12
-
13
-
14
-
15
-
16
-
17
-
18
-
19
-
20
-
21
-
22
-
23
-
24
-
25
-
26
-
27
-
28
-
29
-
30
-
31
-
32
-
33
-
34
-
35
-
36
-
37
-
38
-
39
-
40
-
41
-
42
-
43
-
44
-
45
-
46
-
47
-
48
-
49
-
50
-
51
-
52
-
53
-
54
-
55
-
56
-
57
-
58
-
59
-
60
-
61
-
62
-
63
-
64
-
65
-
66
-
67
-
68
-
69
-
70
-
71
-
72
-
73
-
74
-
75
-
76
-
77
-
78
-
79
-
80
-
81
-
82
-
83
-
84
-
85
-
86
-
87
-
88
-
89
-
90
-
91
-
92
-
93
-
94
-
95
-
96
-
97
-
98
-
99
-
 100
100 -
 101
101 -
 102
102 -
 103
103 -
 104
104 -
 105
105 -
 106
106 -
 107
107 -
 108
108 -
 109
109 -
 110
110 -
 111
111 -
 112
112 -
 113
113 -
 114
114 -
 115
115 -
 116
116 -
 117
117 -
 118
118 -
 119
119 -
 120
120 -
121
-
122
-
123
-
124
-
125
-
126
-
127
-
128
-
129
-
130
-
131
-
132
-
133
-
134
-
135
-
136
-
137
-
138
-
139
-
140
-
141
-
142
-
143
-
144
-
145
-
146
-
147
-
148
-
149
-
150
-
151
-
152
-
153
-
154
-
155
-
156
-
157
-
158
-
159
-
160
-
161
-
162
-
163
-
164
-
165
-
166
-
167
-
168
-
169
-
170
-
171
-
172
-
173
-
174
-
175
-
176
-
177
-
178
-
179
-
180
-
181
-
182
-
183
-
184
-
185
-
186
-
187
-
188
-
189
-
190
-
191
-
192
-
193
-
194
-
195
-
196
-
197
-
198
-
199
-
200
-
201
-
202
-
203
-
204
-
205
-
206
-
207
-
208
-
209
-
210
-
211
-
212
-
213
-
214
-
215
-
216
-
217
-
218
-
219
-
220
-
221
-
222
-
223
-
224
-
225
-
226
-
227
-
228
-
229
-
230
-
231
-
232
-
233
-
234
-
235
-
236
-
237
-
238
-
239
-
240
-
241
-
242
-
243
-
244
-
245
-
246
-
247
-
248
-
249
-
250
-
251
-
252
-
253
-
254
-
255
-
256
-
257
-
258
-
259
-
260
-
261
-
262
-
263
-
264
-
265
-
266
-
267
-
268
-
269
-
270
-
271
-
272
-
273
-
274
-
275
-
276
-
277
-
278
-
279
-
280
-
281
-
282
-
283
-
284
-
285
-
286
-
287
-
288
-
289
-
290
-
291
-
292
-
293
-
294
-
295
 |
 |
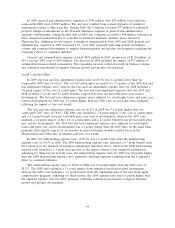
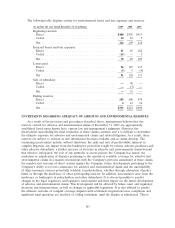
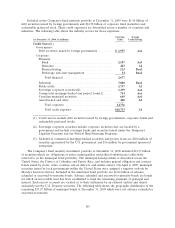
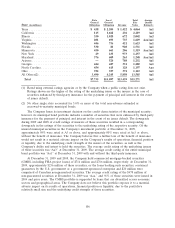
slightly as the Company had expected. While there was an aggregate decrease in the number of claims
received, the number of policyholders tendering asbestos claims for the first time increased from the
number tendering claims for the first time in 2008.
The Company also noted the continuation of recent trends, which included:
• stable payment patterns for a large proportion of policyholders;
• a decrease in the number of claims received;
• a decrease in the number of large asbestos exposures confronting the Company due to
additional settlement activity;
• continued moderate level of asbestos-related bankruptcy activity; and
• the absence of new theories of liability or new classes of defendants.
While the Company believes that these trends indicate a reduction in the volatility associated with
the Company’s overall asbestos exposure, there nonetheless remains a high degree of uncertainty with
respect to future exposure from asbestos claims.
The Company’s quarterly asbestos reserve review includes an analysis of exposure and claim
payment patterns by policyholder category, as well as recent settlements, policyholder bankruptcies,
judicial rulings and legislative actions. Developing payment patterns among policyholders in the ‘‘home
office and field office’’ and ‘‘assumed reinsurance and other’’ categories are also analyzed. In addition,
the Company reviews its historical gross and net loss and expense paid experience, year-by-year, to
assess any emerging trends, fluctuations, or characteristics suggested by the aggregate paid activity. For
certain policyholders an estimate of the gross ultimate exposure for indemnity and related claim
adjustment expense is determined, and for those policyholders the Company calculates, by each policy
year, a ceded reinsurance projection based on any applicable facultative and treaty reinsurance, past
ceded experience and reinsurance collections. Conventional actuarial methods are not utilized to
establish asbestos reserves nor have the Company’s evaluations resulted in any way of determining a
meaningful average asbestos defense or indemnity payment. The completion of these reviews and
analyses in the third quarter resulted in a $185 million increase in the Company’s asbestos reserves,
which was primarily driven by a slight increase in the Company’s assumption for projected defense costs
related to a broad range of policyholders. Overall, the company’s assessment of the underlying asbestos
environment did not change significantly from recent periods. The Company recorded a $70 million
increase to asbestos reserves in 2008, which was driven by a change in the estimated costs associated
with litigating asbestos coverage matters and a change in estimated losses for certain individual
policyholders. The Company recorded no asbestos reserve additions in 2007.
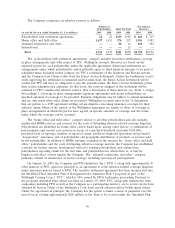
Net asbestos losses paid in 2009, 2008 and 2007 were $341 million, $658 million and $317 million,
respectively. (Asbestos payments in 2008 included the Company’s one-time net payment of $365 million
associated with the settlement of the ACandS, Inc. matter). Approximately 41%, 59% and 20% of total
net paid losses in 2009, 2008 and 2007, respectively, related to policyholders with whom the Company
had entered into settlement agreements limiting the Company’s liability.
98