Travelers 2009 Annual Report Download - page 234
Download and view the complete annual report
Please find page 234 of the 2009 Travelers annual report below. You can navigate through the pages in the report by either clicking on the pages listed below, or by using the keyword search tool below to find specific information within the annual report.-
 1
1 -
2
-
3
-
4
-
5
-
6
-
7
-
8
-
9
-
10
-
11
-
12
-
13
-
14
-
15
-
16
-
17
-
18
-
19
-
20
-
21
-
22
-
23
-
24
-
25
-
26
-
27
-
28
-
29
-
30
-
31
-
32
-
33
-
34
-
35
-
36
-
37
-
38
-
39
-
40
-
41
-
42
-
43
-
44
-
45
-
46
-
47
-
48
-
49
-
50
-
51
-
52
-
53
-
54
-
55
-
56
-
57
-
58
-
59
-
60
-
61
-
62
-
63
-
64
-
65
-
66
-
67
-
68
-
69
-
70
-
71
-
72
-
73
-
74
-
75
-
76
-
77
-
78
-
79
-
80
-
81
-
82
-
83
-
84
-
85
-
86
-
87
-
88
-
89
-
90
-
91
-
92
-
93
-
94
-
95
-
96
-
97
-
98
-
99
-
100
-
101
-
102
-
103
-
104
-
105
-
106
-
107
-
108
-
109
-
110
-
111
-
112
-
113
-
114
-
115
-
116
-
117
-
118
-
119
-
120
-
121
-
122
-
123
-
124
-
125
-
126
-
127
-
128
-
129
-
130
-
131
-
132
-
133
-
134
-
135
-
136
-
137
-
138
-
139
-
140
-
141
-
142
-
143
-
144
-
145
-
146
-
147
-
148
-
149
-
150
-
151
-
152
-
153
-
154
-
155
-
156
-
157
-
158
-
159
-
160
-
161
-
162
-
163
-
164
-
165
-
166
-
167
-
168
-
169
-
170
-
171
-
172
-
173
-
174
-
175
-
176
-
177
-
178
-
179
-
180
-
181
-
182
-
183
-
184
-
185
-
186
-
187
-
188
-
189
-
190
-
191
-
192
-
193
-
194
-
195
-
196
-
197
-
198
-
199
-
200
-
201
-
202
-
203
-
204
-
205
-
206
-
207
-
208
-
209
-
210
-
211
-
212
-
213
-
214
-
215
-
216
-
217
-
218
-
219
-
220
-
221
-
222
-
223
-
 224
224 -
 225
225 -
 226
226 -
 227
227 -
 228
228 -
 229
229 -
 230
230 -
 231
231 -
 232
232 -
 233
233 -
 234
234 -
 235
235 -
 236
236 -
 237
237 -
 238
238 -
 239
239 -
 240
240 -
 241
241 -
 242
242 -
 243
243 -
 244
244 -
245
-
246
-
247
-
248
-
249
-
250
-
251
-
252
-
253
-
254
-
255
-
256
-
257
-
258
-
259
-
260
-
261
-
262
-
263
-
264
-
265
-
266
-
267
-
268
-
269
-
270
-
271
-
272
-
273
-
274
-
275
-
276
-
277
-
278
-
279
-
280
-
281
-
282
-
283
-
284
-
285
-
286
-
287
-
288
-
289
-
290
-
291
-
292
-
293
-
294
-
295
 |
 |

THE TRAVELERS COMPANIES, INC. AND SUBSIDIARIES
NOTES TO CONSOLIDATED FINANCIAL STATEMENTS (Continued)
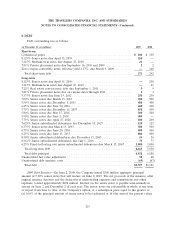
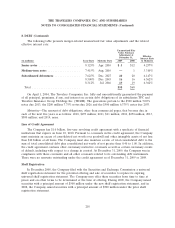
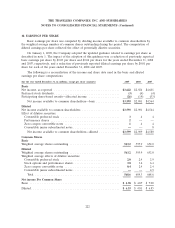
10. EARNINGS PER SHARE
Basic earnings per share was computed by dividing income available to common shareholders by
the weighted average number of common shares outstanding during the period. The computation of
diluted earnings per share reflected the effect of potentially dilutive securities.
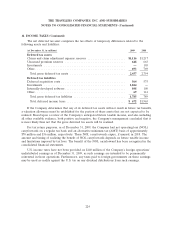
On January 1, 2009, the Company adopted the updated guidance related to earnings per share as
described in note 1. The impact of the adoption of this guidance was a reduction of previously reported
basic earnings per share by $0.03 per share and $0.04 per share for the years ended December 31, 2008
and 2007, respectively, and a reduction of previously reported diluted earnings per share by $0.01 per
share for each of the years ended December 31, 2008 and 2007.
The following is a reconciliation of the income and share data used in the basic and diluted
earnings per share computations:
(for the year ended December 31, in millions, except per share amounts) 2009 2008 2007
Basic
Net income, as reported ...................................... $3,622 $2,924 $4,601
Preferred stock dividends...................................... (3) (4) (4)
Participating share-based awards—allocated income . . . . . . . . . . . . . . . . . . (26) (19) (33)
Net income available to common shareholders—basic . . . . . . . . . . . . . . $3,593 $2,901 $4,564
Diluted
Net income available to common shareholders . . . . . . . . . . . . . . . . . . . . . . $3,593 $2,901 $4,564
Effect of dilutive securities:
Convertible preferred stock .................................. 344
Performance shares ........................................ 2——
Zero coupon convertible notes ................................ 144
Convertible junior subordinated notes . . . . . . . . . . . . . . . . . . . . . . . . . . . ——8
Net income available to common shareholders—diluted . . . . . . . . . . . . $3,599 $2,909 $4,580
Common Shares
Basic
Weighted average shares outstanding . . . . . . . . . . . . . . . . . . . . . . . . . . . . . 563.2 595.9 652.0
Diluted
Weighted average shares outstanding . . . . . . . . . . . . . . . . . . . . . . . . . . . . . 563.2 595.9 652.0
Weighted average effects of dilutive securities:
Convertible preferred stock .................................. 2.0 2.4 2.9
Stock options and performance shares . . . . . . . . . . . . . . . . . . . . . . . . . . . 3.0 3.6 6.4
Zero coupon convertible notes ................................ 0.4 2.4 2.4
Convertible junior subordinated notes . . . . . . . . . . . . . . . . . . . . . . . . . . . —— 4.9
Total ................................................. 568.6 604.3 668.6
Net income Per Common Share
Basic .................................................... $ 6.38 $ 4.87 $ 7.00
Diluted................................................... $ 6.33 $ 4.81 $ 6.85
222