Travelers 2009 Annual Report Download - page 25
Download and view the complete annual report
Please find page 25 of the 2009 Travelers annual report below. You can navigate through the pages in the report by either clicking on the pages listed below, or by using the keyword search tool below to find specific information within the annual report.-
 1
1 -
2
-
3
-
4
-
5
-
6
-
7
-
8
-
9
-
10
-
11
-
12
-
13
-
14
-
 15
15 -
 16
16 -
 17
17 -
 18
18 -
 19
19 -
 20
20 -
 21
21 -
 22
22 -
 23
23 -
 24
24 -
 25
25 -
 26
26 -
 27
27 -
 28
28 -
 29
29 -
 30
30 -
 31
31 -
 32
32 -
 33
33 -
 34
34 -
 35
35 -
36
-
37
-
38
-
39
-
40
-
41
-
42
-
43
-
44
-
45
-
46
-
47
-
48
-
49
-
50
-
51
-
52
-
53
-
54
-
55
-
56
-
57
-
58
-
59
-
60
-
61
-
62
-
63
-
64
-
65
-
66
-
67
-
68
-
69
-
70
-
71
-
72
-
73
-
74
-
75
-
76
-
77
-
78
-
79
-
80
-
81
-
82
-
83
-
84
-
85
-
86
-
87
-
88
-
89
-
90
-
91
-
92
-
93
-
94
-
95
-
96
-
97
-
98
-
99
-
100
-
101
-
102
-
103
-
104
-
105
-
106
-
107
-
108
-
109
-
110
-
111
-
112
-
113
-
114
-
115
-
116
-
117
-
118
-
119
-
120
-
121
-
122
-
123
-
124
-
125
-
126
-
127
-
128
-
129
-
130
-
131
-
132
-
133
-
134
-
135
-
136
-
137
-
138
-
139
-
140
-
141
-
142
-
143
-
144
-
145
-
146
-
147
-
148
-
149
-
150
-
151
-
152
-
153
-
154
-
155
-
156
-
157
-
158
-
159
-
160
-
161
-
162
-
163
-
164
-
165
-
166
-
167
-
168
-
169
-
170
-
171
-
172
-
173
-
174
-
175
-
176
-
177
-
178
-
179
-
180
-
181
-
182
-
183
-
184
-
185
-
186
-
187
-
188
-
189
-
190
-
191
-
192
-
193
-
194
-
195
-
196
-
197
-
198
-
199
-
200
-
201
-
202
-
203
-
204
-
205
-
206
-
207
-
208
-
209
-
210
-
211
-
212
-
213
-
214
-
215
-
216
-
217
-
218
-
219
-
220
-
221
-
222
-
223
-
224
-
225
-
226
-
227
-
228
-
229
-
230
-
231
-
232
-
233
-
234
-
235
-
236
-
237
-
238
-
239
-
240
-
241
-
242
-
243
-
244
-
245
-
246
-
247
-
248
-
249
-
250
-
251
-
252
-
253
-
254
-
255
-
256
-
257
-
258
-
259
-
260
-
261
-
262
-
263
-
264
-
265
-
266
-
267
-
268
-
269
-
270
-
271
-
272
-
273
-
274
-
275
-
276
-
277
-
278
-
279
-
280
-
281
-
282
-
283
-
284
-
285
-
286
-
287
-
288
-
289
-
290
-
291
-
292
-
293
-
294
-
295
 |
 |

Other coverages include Property, Workers’ Compensation, Commercial Automobile and
Commercial Multi-Peril, which are described in more detail in the ‘‘Business Insurance’’ section of this
narrative.
Net Retention Policy
The following discussion reflects the Company’s retention policy with respect to the Financial,
Professional & International Insurance segment as of January 1, 2010. In the U.S. operations for third
party liability, including but not limited to umbrella liability, professional liability, directors’ and
officers’ liability, and employment practices liability, Financial, Professional & International Insurance
generally limits net retentions, through the use of reinsurance, up to $15.3 million per policy after the
Company retains an aggregate layer of expected losses. For surety protection, where insured limits are
often significant, the Company generally retains up to $55.0 million probable maximum loss (PML) per
principal but may retain higher amounts based on the type of obligation, credit quality and other credit
risk factors. In the International operations, per-risk retentions are usually limited to $16 million.
Reinsurance treaties often have aggregate limits or caps which may result in larger net per risk
retentions if the aggregate limits or caps are reached. The Company utilizes facultative reinsurance to
provide additional limits capacity or to reduce retentions on an individual risk basis. The Company may
also retain amounts greater than those described herein based upon the individual characteristics of the
risk.
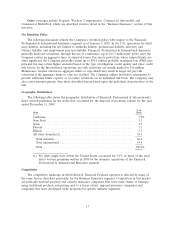
Geographic Distribution
The following table shows the geographic distribution of Financial, Professional & International’s
direct written premiums for the states that accounted for the majority of premium volume for the year
ended December 31, 2009:
% of
State Total
California.................................................. 5.9%
New York ................................................. 5.3
Texas..................................................... 4.5
Florida ................................................... 3.3
Illinois.................................................... 3.1
All other domestic(1) ......................................... 38.5
Total domestic............................................. 60.6
Total international.......................................... 39.4
Total ................................................... 100.0%
(1) No other single state within the United States accounted for 3.0% or more of the total
direct written premiums written in 2009 by the domestic operations of the Financial,
Professional & International Insurance segment.
Competition
The competitive landscape in which Bond & Financial Products operates is affected by many of
the same factors described previously for the Business Insurance segment. Competitors in this market
are primarily national property and casualty insurance companies that write most classes of business
using traditional products and pricing and, to a lesser extent, regional insurance companies and
companies that have developed niche programs for specific industry segments.
13