Travelers 2009 Annual Report Download - page 106
Download and view the complete annual report
Please find page 106 of the 2009 Travelers annual report below. You can navigate through the pages in the report by either clicking on the pages listed below, or by using the keyword search tool below to find specific information within the annual report.-
 1
1 -
2
-
3
-
4
-
5
-
6
-
7
-
8
-
9
-
10
-
11
-
12
-
13
-
14
-
15
-
16
-
17
-
18
-
19
-
20
-
21
-
22
-
23
-
24
-
25
-
26
-
27
-
28
-
29
-
30
-
31
-
32
-
33
-
34
-
35
-
36
-
37
-
38
-
39
-
40
-
41
-
42
-
43
-
44
-
45
-
46
-
47
-
48
-
49
-
50
-
51
-
52
-
53
-
54
-
55
-
56
-
57
-
58
-
59
-
60
-
61
-
62
-
63
-
64
-
65
-
66
-
67
-
68
-
69
-
70
-
71
-
72
-
73
-
74
-
75
-
76
-
77
-
78
-
79
-
80
-
81
-
82
-
83
-
84
-
85
-
86
-
87
-
88
-
89
-
90
-
91
-
92
-
93
-
94
-
95
-
 96
96 -
 97
97 -
 98
98 -
 99
99 -
 100
100 -
 101
101 -
 102
102 -
 103
103 -
 104
104 -
 105
105 -
 106
106 -
 107
107 -
 108
108 -
 109
109 -
 110
110 -
 111
111 -
 112
112 -
 113
113 -
 114
114 -
 115
115 -
 116
116 -
117
-
118
-
119
-
120
-
121
-
122
-
123
-
124
-
125
-
126
-
127
-
128
-
129
-
130
-
131
-
132
-
133
-
134
-
135
-
136
-
137
-
138
-
139
-
140
-
141
-
142
-
143
-
144
-
145
-
146
-
147
-
148
-
149
-
150
-
151
-
152
-
153
-
154
-
155
-
156
-
157
-
158
-
159
-
160
-
161
-
162
-
163
-
164
-
165
-
166
-
167
-
168
-
169
-
170
-
171
-
172
-
173
-
174
-
175
-
176
-
177
-
178
-
179
-
180
-
181
-
182
-
183
-
184
-
185
-
186
-
187
-
188
-
189
-
190
-
191
-
192
-
193
-
194
-
195
-
196
-
197
-
198
-
199
-
200
-
201
-
202
-
203
-
204
-
205
-
206
-
207
-
208
-
209
-
210
-
211
-
212
-
213
-
214
-
215
-
216
-
217
-
218
-
219
-
220
-
221
-
222
-
223
-
224
-
225
-
226
-
227
-
228
-
229
-
230
-
231
-
232
-
233
-
234
-
235
-
236
-
237
-
238
-
239
-
240
-
241
-
242
-
243
-
244
-
245
-
246
-
247
-
248
-
249
-
250
-
251
-
252
-
253
-
254
-
255
-
256
-
257
-
258
-
259
-
260
-
261
-
262
-
263
-
264
-
265
-
266
-
267
-
268
-
269
-
270
-
271
-
272
-
273
-
274
-
275
-
276
-
277
-
278
-
279
-
280
-
281
-
282
-
283
-
284
-
285
-
286
-
287
-
288
-
289
-
290
-
291
-
292
-
293
-
294
-
295
 |
 |
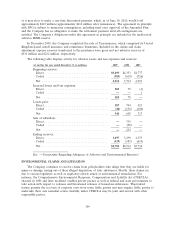
In 2009, general and administrative expenses of $784 million were $45 million lower than the
comparable 2008 total of $829 million. The decrease resulted from revised estimates of windpool
assessments related to Hurricane Ike. During 2008, the Company recorded $77 million of estimated
property windpool assessments in the Personal Insurance segment in general and administrative
expenses. Subsequently, during the first half of 2009, the Company recorded a $48 million reduction in
these estimated assessments due to a decline in estimated insurance industry losses related to
Hurricane Ike. Adjusting for the impact of windpool assessments in both 2009 and 2008, general and
administrative expenses in 2009 increased 11%, over 2008, primarily reflecting growth in business
volume and continued investments to support business growth and product development, including the
Company’s direct to consumer initiative.
General and administrative expenses totaled $829 million in 2008, an increase of $130 million, or
19% over the 2007 total of $699 million. The increase in 2008 included the impact of $77 million of
estimated hurricane-related assessments. The remaining increase reflected growth in business volume
and continued investments to support business growth and product development.
GAAP Combined Ratio
In 2009, the loss and loss adjustment expense ratio of 65.0% was 1.2 points lower than the
comparable 2008 ratio of 66.2%. The cost of catastrophes accounted for 3.9 points of the 2009 loss and
loss adjustment expense ratio, whereas the loss and loss adjustment expense ratio for 2008 included a
7.8 point impact of the cost of catastrophes. The loss and loss adjustment expense ratio for 2009 and
2008 included 1.9 point and 2.1 point benefits, respectively from net favorable prior year reserve
development. The loss and loss adjustment expense ratios adjusted for catastrophe losses and prior year
reserve development for 2009 was 2.5 points higher than the 2008 ratio on the same basis, primarily
reflecting the impact of loss cost trends.
The loss and loss adjustment expense ratio of 66.2% in 2008 was 7.6 points higher than the
comparable 2007 ratio of 58.6%. The 2008 ratio included a 7.8 point impact of the cost of catastrophes
and a 2.1 point benefit from net favorable prior year reserve development, whereas the 2007 ratio
included a 2.4 point impact of the cost of catastrophes and a 2.2 point benefit from net favorable prior
year reserve development. The 2008 loss and loss adjustment expense ratio adjusted for catastrophe
losses and prior year reserve development was 2.1 points higher than the 2007 ratio on the same basis,
primarily reflecting the impact of an increase in non-catastrophe weather related losses in the
Homeowners and Other line of business and loss cost trends.
In 2009, the underwriting expense ratio of 29.6% was 1.2 points lower than the underwriting
expense ratio of 30.8% in 2008. The 2009 underwriting expense ratio included a 0.7 point benefit from
the reduction in the estimate of windpool assessments described above, whereas the 2008 underwriting
expense ratio included a 1.1 point increase due to the impact related to the windpool assessments.
Adjusting for these factors in both years, the underwriting expense ratio for 2009 was 0.6 points higher
than the 2008 underwriting expense ratio, primarily reflecting expenses resulting from the Company’s
direct to consumer initiative.
The underwriting expense ratio of 30.8% in 2008 was 2.6 points higher than the 2007 ratio of
28.2%. The 2008 ratio included a 1.1 point impact from estimated hurricane-related assessments,
whereas the 2007 ratio included a 1.0 point benefit from the implementation of the new fixed agent
compensation program. Adjusting for these factors, the 2008 expense ratio was 0.5 points higher than
the adjusted expense ratio for 2007, primarily reflecting continued investments to support business
growth and product development.
94