Travelers 2009 Annual Report Download - page 55
Download and view the complete annual report
Please find page 55 of the 2009 Travelers annual report below. You can navigate through the pages in the report by either clicking on the pages listed below, or by using the keyword search tool below to find specific information within the annual report.-
 1
1 -
2
-
3
-
4
-
5
-
6
-
7
-
8
-
9
-
10
-
11
-
12
-
13
-
14
-
15
-
16
-
17
-
18
-
19
-
20
-
21
-
22
-
23
-
24
-
25
-
26
-
27
-
28
-
29
-
30
-
31
-
32
-
33
-
34
-
35
-
36
-
37
-
38
-
39
-
40
-
41
-
42
-
43
-
44
-
 45
45 -
 46
46 -
 47
47 -
 48
48 -
 49
49 -
 50
50 -
 51
51 -
 52
52 -
 53
53 -
 54
54 -
 55
55 -
 56
56 -
 57
57 -
 58
58 -
 59
59 -
 60
60 -
 61
61 -
 62
62 -
 63
63 -
 64
64 -
 65
65 -
66
-
67
-
68
-
69
-
70
-
71
-
72
-
73
-
74
-
75
-
76
-
77
-
78
-
79
-
80
-
81
-
82
-
83
-
84
-
85
-
86
-
87
-
88
-
89
-
90
-
91
-
92
-
93
-
94
-
95
-
96
-
97
-
98
-
99
-
100
-
101
-
102
-
103
-
104
-
105
-
106
-
107
-
108
-
109
-
110
-
111
-
112
-
113
-
114
-
115
-
116
-
117
-
118
-
119
-
120
-
121
-
122
-
123
-
124
-
125
-
126
-
127
-
128
-
129
-
130
-
131
-
132
-
133
-
134
-
135
-
136
-
137
-
138
-
139
-
140
-
141
-
142
-
143
-
144
-
145
-
146
-
147
-
148
-
149
-
150
-
151
-
152
-
153
-
154
-
155
-
156
-
157
-
158
-
159
-
160
-
161
-
162
-
163
-
164
-
165
-
166
-
167
-
168
-
169
-
170
-
171
-
172
-
173
-
174
-
175
-
176
-
177
-
178
-
179
-
180
-
181
-
182
-
183
-
184
-
185
-
186
-
187
-
188
-
189
-
190
-
191
-
192
-
193
-
194
-
195
-
196
-
197
-
198
-
199
-
200
-
201
-
202
-
203
-
204
-
205
-
206
-
207
-
208
-
209
-
210
-
211
-
212
-
213
-
214
-
215
-
216
-
217
-
218
-
219
-
220
-
221
-
222
-
223
-
224
-
225
-
226
-
227
-
228
-
229
-
230
-
231
-
232
-
233
-
234
-
235
-
236
-
237
-
238
-
239
-
240
-
241
-
242
-
243
-
244
-
245
-
246
-
247
-
248
-
249
-
250
-
251
-
252
-
253
-
254
-
255
-
256
-
257
-
258
-
259
-
260
-
261
-
262
-
263
-
264
-
265
-
266
-
267
-
268
-
269
-
270
-
271
-
272
-
273
-
274
-
275
-
276
-
277
-
278
-
279
-
280
-
281
-
282
-
283
-
284
-
285
-
286
-
287
-
288
-
289
-
290
-
291
-
292
-
293
-
294
-
295
 |
 |
National Association of
Insurance Commissioners
(NAIC) . . . . . . . . . . . . . . . . An organization of the insurance commissioners or directors of all
50 states, the District of Columbia and the five U.S. territories
organized to promote consistency of regulatory practice and
statutory accounting standards throughout the United States.
Net written premiums . . . . . . . . Direct written premiums plus assumed reinsurance premiums less
premiums ceded to reinsurers.
Operating income (loss) . . . . . . Net income (loss) excluding the after-tax impact of net realized
investment gains (losses), discontinued operations and cumulative
effect of changes in accounting principles when applicable.
Operating income (loss) per
share . . . . . . . . . . . . . . . . . . Operating income (loss) on a per share basis.
Operating return on equity . . . . The ratio of operating income to average equity excluding net
unrealized investment gains and losses and discontinued operations,
net of tax.
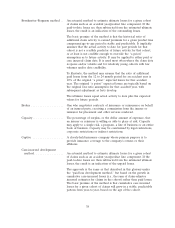
Paid development method . . . . . An actuarial method to estimate ultimate losses for a given cohort
of claims such as an accident year/product line component. If the
paid-to-date losses are then subtracted from the estimated ultimate
losses, the result is an indication of the unpaid losses.
The basic premise of the method is that cumulative paid losses for
a given cohort of claims will grow in a stable, predictable pattern
from year-to-year, based on the age of the cohort. These age-to-age
growth factors are sometimes called ‘‘link ratios.’’
For example, if cumulative paid losses for a product line XYZ for
accident year 2004 were $100 as of December 31, 2004 (12 months
after the start of that accident year), then grew to $120 as of
December 31, 2005 (24 months after the start), the link ratio for
that accident year from 12 to 24 months would be 1.20. If the link
ratio for other recent accident years from 12 to 24 months for that
product line were also at or around 1.20, then the method would
assume a similar result for the most recent accident year, i.e., that it
too would have its cumulative paid losses grow 120% from the
12 month to 24 month valuation.
This is repeated for each age-to-age period into the future until the
age-to-age link ratios for future periods are assumed to be 1.0
(i.e., the age at which cumulative losses are assumed to have
stopped growing).
A given accident year’s cumulative losses are then projected to
ultimate by multiplying current cumulative losses by successive
age-to-age link ratios up to that future age where growth is
expected to end. For example, if growth is expected to end at
60 months, then the ultimate indication for an accident year with
cumulative losses at 12 months equals those losses times a 12 to
24 month link ratio, times a 24 to 36 month link ratio, times a 36 to
48 month link ratio, times a 48 to 60 month link ratio.
43