Travelers 2009 Annual Report Download - page 88
Download and view the complete annual report
Please find page 88 of the 2009 Travelers annual report below. You can navigate through the pages in the report by either clicking on the pages listed below, or by using the keyword search tool below to find specific information within the annual report.-
 1
1 -
2
-
3
-
4
-
5
-
6
-
7
-
8
-
9
-
10
-
11
-
12
-
13
-
14
-
15
-
16
-
17
-
18
-
19
-
20
-
21
-
22
-
23
-
24
-
25
-
26
-
27
-
28
-
29
-
30
-
31
-
32
-
33
-
34
-
35
-
36
-
37
-
38
-
39
-
40
-
41
-
42
-
43
-
44
-
45
-
46
-
47
-
48
-
49
-
50
-
51
-
52
-
53
-
54
-
55
-
56
-
57
-
58
-
59
-
60
-
61
-
62
-
63
-
64
-
65
-
66
-
67
-
68
-
69
-
70
-
71
-
72
-
73
-
74
-
75
-
76
-
77
-
 78
78 -
 79
79 -
 80
80 -
 81
81 -
 82
82 -
 83
83 -
 84
84 -
 85
85 -
 86
86 -
 87
87 -
 88
88 -
 89
89 -
 90
90 -
 91
91 -
 92
92 -
 93
93 -
 94
94 -
 95
95 -
 96
96 -
 97
97 -
 98
98 -
99
-
100
-
101
-
102
-
103
-
104
-
105
-
106
-
107
-
108
-
109
-
110
-
111
-
112
-
113
-
114
-
115
-
116
-
117
-
118
-
119
-
120
-
121
-
122
-
123
-
124
-
125
-
126
-
127
-
128
-
129
-
130
-
131
-
132
-
133
-
134
-
135
-
136
-
137
-
138
-
139
-
140
-
141
-
142
-
143
-
144
-
145
-
146
-
147
-
148
-
149
-
150
-
151
-
152
-
153
-
154
-
155
-
156
-
157
-
158
-
159
-
160
-
161
-
162
-
163
-
164
-
165
-
166
-
167
-
168
-
169
-
170
-
171
-
172
-
173
-
174
-
175
-
176
-
177
-
178
-
179
-
180
-
181
-
182
-
183
-
184
-
185
-
186
-
187
-
188
-
189
-
190
-
191
-
192
-
193
-
194
-
195
-
196
-
197
-
198
-
199
-
200
-
201
-
202
-
203
-
204
-
205
-
206
-
207
-
208
-
209
-
210
-
211
-
212
-
213
-
214
-
215
-
216
-
217
-
218
-
219
-
220
-
221
-
222
-
223
-
224
-
225
-
226
-
227
-
228
-
229
-
230
-
231
-
232
-
233
-
234
-
235
-
236
-
237
-
238
-
239
-
240
-
241
-
242
-
243
-
244
-
245
-
246
-
247
-
248
-
249
-
250
-
251
-
252
-
253
-
254
-
255
-
256
-
257
-
258
-
259
-
260
-
261
-
262
-
263
-
264
-
265
-
266
-
267
-
268
-
269
-
270
-
271
-
272
-
273
-
274
-
275
-
276
-
277
-
278
-
279
-
280
-
281
-
282
-
283
-
284
-
285
-
286
-
287
-
288
-
289
-
290
-
291
-
292
-
293
-
294
-
295
 |
 |

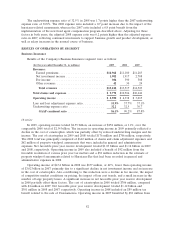
portion of the investment portfolio at December 31, 2008 totaled $66.79 billion, $2.55 billion lower than
at the same date in 2007, primarily reflecting the use of $2.12 billion of funds for the Company’s
common share repurchases during 2008, the payment of $715 million of dividends to shareholders, the
transfer of $662 million of fixed maturity investments as part of the sale of Unionamerica, and
$450 million of contributions to the Company’s pension plan, which were partially offset by strong cash
flows from operating activities.
Except as described below for certain legal entities, the Company allocates its invested assets and
the related net investment income to its reportable business segments. Pretax net investment income is
allocated based upon an investable funds concept, which takes into account liabilities (net of
non-invested assets) and appropriate capital considerations for each segment. For investable funds, a
benchmark investment yield is developed that reflects the estimated duration of the loss reserves’ future
cash flows, the interest rate environment at the time the losses were incurred and A+ rated corporate
debt instrument yields. For capital, a benchmark investment yield is developed that reflects the average
yield on the total investment portfolio. The benchmark investment yields are applied to each segment’s
investable funds and capital, respectively, to produce a total notional investment income by segment.
The Company’s actual net investment income is allocated to each segment in proportion to the
respective segment’s notional investment income to total notional investment income. There are certain
legal entities within the Company that are dedicated to specific reportable business segments. The
invested assets and related net investment income from these legal entities are reported in the
applicable business segment and are not allocated among the other business segments.
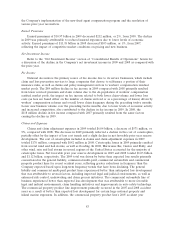
Fee Income
The National Accounts market in the Business Insurance segment is the primary source of the
Company’s fee-based business. The declines in fee income in 2009 and 2008 compared with the
respective prior years are described in the Business Insurance segment discussion that follows.
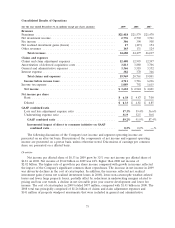
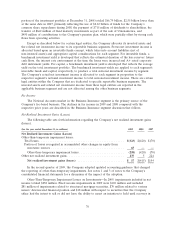
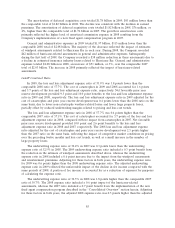
Net Realized Investment Gains (Losses)
The following table sets forth information regarding the Company’s net realized investment gains
(losses).
(for the year ended December 31, in millions) 2009 2008 2007
Net Realized Investment Gains (Losses)
Other-than-temporary impairment losses:
Total losses................................................. $(323) $(420) $ (70)
Portion of losses recognized in accumulated other changes in equity from
nonowner sources .......................................... 65 ——
Other-than-temporary impairment losses . . . . . . . . . . . . . . . . . . . . . . . . . . (258) (420) (70)
Other net realized investment gains . . . . . . . . . . . . . . . . . . . . . . . . . . . . . . . . . 275 5 224
Net realized investment gains (losses) ........................... $17 $(415) $154
In the second quarter of 2009, the Company adopted updated accounting guidance that changed
the reporting of other-than-temporary impairments. See notes 1 and 3 of notes to the Company’s
consolidated financial statements for a discussion of the impact of the adoption.
Other-Than-Temporary Impairment Losses on Investments—In 2009, impairments included in net
income totaled $258 million. Fixed income impairments in 2009 were $169 million and included
$81 million of impairments related to structured mortgage securities, $70 million related to various
issuers’ deteriorated financial position and $18 million with respect to securities that the Company
either had the intent to sell or did not have the ability to assert an intention to hold until recovery in
76