Travelers 2009 Annual Report Download - page 117
Download and view the complete annual report
Please find page 117 of the 2009 Travelers annual report below. You can navigate through the pages in the report by either clicking on the pages listed below, or by using the keyword search tool below to find specific information within the annual report.-
 1
1 -
2
-
3
-
4
-
5
-
6
-
7
-
8
-
9
-
10
-
11
-
12
-
13
-
14
-
15
-
16
-
17
-
18
-
19
-
20
-
21
-
22
-
23
-
24
-
25
-
26
-
27
-
28
-
29
-
30
-
31
-
32
-
33
-
34
-
35
-
36
-
37
-
38
-
39
-
40
-
41
-
42
-
43
-
44
-
45
-
46
-
47
-
48
-
49
-
50
-
51
-
52
-
53
-
54
-
55
-
56
-
57
-
58
-
59
-
60
-
61
-
62
-
63
-
64
-
65
-
66
-
67
-
68
-
69
-
70
-
71
-
72
-
73
-
74
-
75
-
76
-
77
-
78
-
79
-
80
-
81
-
82
-
83
-
84
-
85
-
86
-
87
-
88
-
89
-
90
-
91
-
92
-
93
-
94
-
95
-
96
-
97
-
98
-
99
-
100
-
101
-
102
-
103
-
104
-
105
-
106
-
 107
107 -
 108
108 -
 109
109 -
 110
110 -
 111
111 -
 112
112 -
 113
113 -
 114
114 -
 115
115 -
 116
116 -
 117
117 -
 118
118 -
 119
119 -
 120
120 -
 121
121 -
 122
122 -
 123
123 -
 124
124 -
 125
125 -
 126
126 -
 127
127 -
128
-
129
-
130
-
131
-
132
-
133
-
134
-
135
-
136
-
137
-
138
-
139
-
140
-
141
-
142
-
143
-
144
-
145
-
146
-
147
-
148
-
149
-
150
-
151
-
152
-
153
-
154
-
155
-
156
-
157
-
158
-
159
-
160
-
161
-
162
-
163
-
164
-
165
-
166
-
167
-
168
-
169
-
170
-
171
-
172
-
173
-
174
-
175
-
176
-
177
-
178
-
179
-
180
-
181
-
182
-
183
-
184
-
185
-
186
-
187
-
188
-
189
-
190
-
191
-
192
-
193
-
194
-
195
-
196
-
197
-
198
-
199
-
200
-
201
-
202
-
203
-
204
-
205
-
206
-
207
-
208
-
209
-
210
-
211
-
212
-
213
-
214
-
215
-
216
-
217
-
218
-
219
-
220
-
221
-
222
-
223
-
224
-
225
-
226
-
227
-
228
-
229
-
230
-
231
-
232
-
233
-
234
-
235
-
236
-
237
-
238
-
239
-
240
-
241
-
242
-
243
-
244
-
245
-
246
-
247
-
248
-
249
-
250
-
251
-
252
-
253
-
254
-
255
-
256
-
257
-
258
-
259
-
260
-
261
-
262
-
263
-
264
-
265
-
266
-
267
-
268
-
269
-
270
-
271
-
272
-
273
-
274
-
275
-
276
-
277
-
278
-
279
-
280
-
281
-
282
-
283
-
284
-
285
-
286
-
287
-
288
-
289
-
290
-
291
-
292
-
293
-
294
-
295
 |
 |

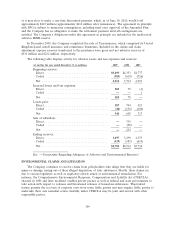
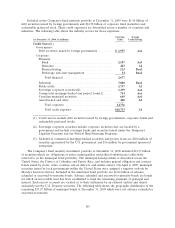
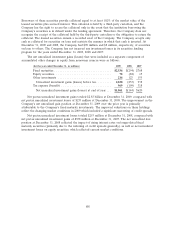
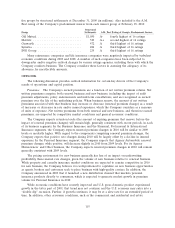
Included in the Company’s fixed maturity portfolio at December 31, 2009 were $1.96 billion of
debt securities issued by foreign governments and $14.78 billion of corporate fixed maturities and
redeemable preferred stock. These credit exposures are diversified across a number of countries and
industries. The following table shows the industry sectors for those exposures.
Carrying Average
(at December 31, 2009, in millions) Value Credit Rating
Credit Sector(1)
Government:
Debt securities issued by foreign governments . . . . . . . . $ 1,957 Aaa
Corporate:
Financial
Bank .................................... 2,107 Aa3
Insurance................................. 423 A2
Finance/leasing............................. 113 Baa3
Brokerage and asset management . . . . . . . . . . . . . . . 34 Baa2
Total financial ............................ 2,677
Industrial................................... 7,080 Baa1
Public utility................................. 1,737 A3
Sovereign corporate securities(2) . . . . . . . . . . . . . . . . . . 1,499 Aaa
Commercial mortgage-backed and project loans(3) . . . . . 714 Aaa
Canadian municipal securities . . . . . . . . . . . . . . . . . . . . 669 Aa1
Asset-backed and other......................... 400 A3
Total corporate ........................... 14,776
Total credit exposure . . . . . . . . . . . . . . . . . . . . . . . $16,733 A1
(1) Credit sectors include debt securities issued by foreign governments, corporate bonds and
redeemable preferred stocks.
(2) Sovereign corporate securities include corporate securities that are backed by a
government and include sovereign banks and securities issued under the Temporary
Liquidity Guaranty and the Federal Ship Financing Programs.
(3) Included in commercial mortgage-backed securities and project loans are $200 million of
securities guaranteed by the U.S. government and $36 million by government sponsored
enterprises.
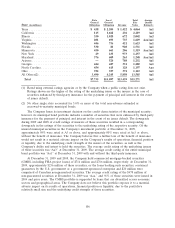
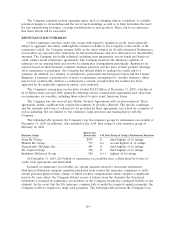
The Company’s fixed maturity investment portfolio at December 31, 2009 included $41.33 billion
of securities which are obligations of states, municipalities and political subdivisions (collectively
referred to as the municipal bond portfolio). The municipal bond portfolio is diversified across the
United States, the District of Columbia and Puerto Rico, and includes general obligation and revenue
bonds issued by states, cities, counties, school districts, and similar issuers. On April 2, 2009, municipal
securities issued by local governments within the United States were assigned a negative outlook by
Moody’s Investors Service. Included in the municipal bond portfolio are $6.06 billion of advance
refunded or escrowed-to-maturity bonds. Advance refunded and escrowed-to-maturity bonds are bonds
for which an irrevocable trust has been established to fund the remaining payments of principal and
interest. Such escrow accounts are verified as to their sufficiency by an external auditor and almost
exclusively involve U.S. Treasury securities. The following table shows the geographic distribution of the
remaining $35.27 billion of municipal bonds at December 31, 2009 which were not advance refunded or
escrowed-to-maturity.
105