Travelers 2009 Annual Report Download - page 118
Download and view the complete annual report
Please find page 118 of the 2009 Travelers annual report below. You can navigate through the pages in the report by either clicking on the pages listed below, or by using the keyword search tool below to find specific information within the annual report.-
 1
1 -
2
-
3
-
4
-
5
-
6
-
7
-
8
-
9
-
10
-
11
-
12
-
13
-
14
-
15
-
16
-
17
-
18
-
19
-
20
-
21
-
22
-
23
-
24
-
25
-
26
-
27
-
28
-
29
-
30
-
31
-
32
-
33
-
34
-
35
-
36
-
37
-
38
-
39
-
40
-
41
-
42
-
43
-
44
-
45
-
46
-
47
-
48
-
49
-
50
-
51
-
52
-
53
-
54
-
55
-
56
-
57
-
58
-
59
-
60
-
61
-
62
-
63
-
64
-
65
-
66
-
67
-
68
-
69
-
70
-
71
-
72
-
73
-
74
-
75
-
76
-
77
-
78
-
79
-
80
-
81
-
82
-
83
-
84
-
85
-
86
-
87
-
88
-
89
-
90
-
91
-
92
-
93
-
94
-
95
-
96
-
97
-
98
-
99
-
100
-
101
-
102
-
103
-
104
-
105
-
106
-
107
-
 108
108 -
 109
109 -
 110
110 -
 111
111 -
 112
112 -
 113
113 -
 114
114 -
 115
115 -
 116
116 -
 117
117 -
 118
118 -
 119
119 -
 120
120 -
 121
121 -
 122
122 -
 123
123 -
 124
124 -
 125
125 -
 126
126 -
 127
127 -
 128
128 -
129
-
130
-
131
-
132
-
133
-
134
-
135
-
136
-
137
-
138
-
139
-
140
-
141
-
142
-
143
-
144
-
145
-
146
-
147
-
148
-
149
-
150
-
151
-
152
-
153
-
154
-
155
-
156
-
157
-
158
-
159
-
160
-
161
-
162
-
163
-
164
-
165
-
166
-
167
-
168
-
169
-
170
-
171
-
172
-
173
-
174
-
175
-
176
-
177
-
178
-
179
-
180
-
181
-
182
-
183
-
184
-
185
-
186
-
187
-
188
-
189
-
190
-
191
-
192
-
193
-
194
-
195
-
196
-
197
-
198
-
199
-
200
-
201
-
202
-
203
-
204
-
205
-
206
-
207
-
208
-
209
-
210
-
211
-
212
-
213
-
214
-
215
-
216
-
217
-
218
-
219
-
220
-
221
-
222
-
223
-
224
-
225
-
226
-
227
-
228
-
229
-
230
-
231
-
232
-
233
-
234
-
235
-
236
-
237
-
238
-
239
-
240
-
241
-
242
-
243
-
244
-
245
-
246
-
247
-
248
-
249
-
250
-
251
-
252
-
253
-
254
-
255
-
256
-
257
-
258
-
259
-
260
-
261
-
262
-
263
-
264
-
265
-
266
-
267
-
268
-
269
-
270
-
271
-
272
-
273
-
274
-
275
-
276
-
277
-
278
-
279
-
280
-
281
-
282
-
283
-
284
-
285
-
286
-
287
-
288
-
289
-
290
-
291
-
292
-
293
-
294
-
295
 |
 |

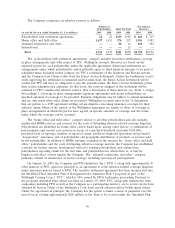
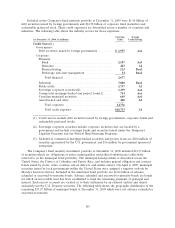
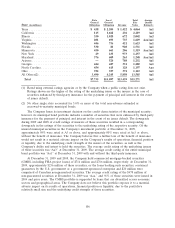
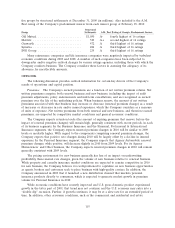
State Local Total Average
General General Fair Quality
State (in millions) Obligation Obligation Revenue Value Rating(1)
Texas................................. $ 438 $ 2,204 $ 1,422 $ 4,064 Aa1
California ............................. 115 1,668 436 2,219 Aa2
Illinois................................ 350 1,020 672 2,042 Aa2
Virginia............................... 201 693 735 1,629 Aaa/Aa1
Washington ............................ 446 756 421 1,623 Aa1
Florida ............................... 530 81 920 1,531 Aa1
Minnesota ............................. 450 663 206 1,319 Aaa/Aa1
New York ............................. 49 235 973 1,257 Aa1
Maryland.............................. 376 609 263 1,248 Aaa/Aa1
Arizona............................... — 524 708 1,232 Aa1
Georgia............................... 444 427 331 1,202 Aa1
North Carolina.......................... 454 615 128 1,197 Aaa
Ohio ................................. 392 357 374 1,123 Aa1
All Others(2)........................... 3,490 4,245 5,850 13,585 Aa1
Total ............................... $7,735 $14,097 $13,439 $35,271 Aa1
(1) Rated using external ratings agencies or by the Company when a public rating does not exist.
Ratings shown are the higher of the rating of the underlying issuer or the insurer in the case of
securities enhanced by third-party insurance for the payment of principal and interest in the event
of issuer default.
(2) No other single state accounted for 3.0% or more of the total non-advance-refunded or
escrowed-to-maturity municipal bonds.
The Company bases its investment decision on the credit characteristics of the municipal security;
however, its municipal bond portfolio includes a number of securities that were enhanced by third-party
insurance for the payment of principal and interest in the event of an issuer default. The downgrade
during 2009 and 2008 of credit ratings of insurers of these securities resulted in a corresponding
downgrade in the ratings of the securities to the underlying rating of the respective security. Of the
insured municipal securities in the Company’s investment portfolio at December 31, 2009,
approximately 98% were rated at A3 or above, and approximately 80% were rated at Aa3 or above,
without the benefit of insurance. The Company believes that a further loss of the benefit of insurance
would not result in a material adverse impact on the Company’s results of operations, financial position
or liquidity, due to the underlying credit strength of the issuers of the securities, as well as the
Company’s ability and intent to hold the securities. The average credit rating of the underlying issuers
of these securities was ‘‘Aa3’’ at December 31, 2009. The average credit rating of the entire municipal
bond portfolio was ‘‘Aa1’’ at December 31, 2009 with and without the third-party insurance.
At December 31, 2009 and 2008, the Company held commercial mortgage-backed securities
(CMBS, including FHA project loans) of $714 million and $766 million, respectively. At December 31,
2009, approximately $236 million of these securities, or the loans backing such securities, contained
guarantees by the U.S. government or a government-sponsored enterprise and $20 million were
comprised of Canadian non-guaranteed securities. The average credit rating of the $478 million of
non-guaranteed securities at December 31, 2009 was ‘‘Aaa,’’ and 91% of those securities were issued in
2004 and prior years. The CMBS portfolio is supported by loans that are diversified across economic
sectors and geographical areas. The Company does not believe this portfolio exposes it to a material
adverse impact on its results of operations, financial position or liquidity, due to the portfolio’s
relatively small size and the underlying credit strength of these securities.
106