Travelers 2009 Annual Report Download - page 101
Download and view the complete annual report
Please find page 101 of the 2009 Travelers annual report below. You can navigate through the pages in the report by either clicking on the pages listed below, or by using the keyword search tool below to find specific information within the annual report.-
 1
1 -
2
-
3
-
4
-
5
-
6
-
7
-
8
-
9
-
10
-
11
-
12
-
13
-
14
-
15
-
16
-
17
-
18
-
19
-
20
-
21
-
22
-
23
-
24
-
25
-
26
-
27
-
28
-
29
-
30
-
31
-
32
-
33
-
34
-
35
-
36
-
37
-
38
-
39
-
40
-
41
-
42
-
43
-
44
-
45
-
46
-
47
-
48
-
49
-
50
-
51
-
52
-
53
-
54
-
55
-
56
-
57
-
58
-
59
-
60
-
61
-
62
-
63
-
64
-
65
-
66
-
67
-
68
-
69
-
70
-
71
-
72
-
73
-
74
-
75
-
76
-
77
-
78
-
79
-
80
-
81
-
82
-
83
-
84
-
85
-
86
-
87
-
88
-
89
-
90
-
 91
91 -
 92
92 -
 93
93 -
 94
94 -
 95
95 -
 96
96 -
 97
97 -
 98
98 -
 99
99 -
 100
100 -
 101
101 -
 102
102 -
 103
103 -
 104
104 -
 105
105 -
 106
106 -
 107
107 -
 108
108 -
 109
109 -
 110
110 -
 111
111 -
112
-
113
-
114
-
115
-
116
-
117
-
118
-
119
-
120
-
121
-
122
-
123
-
124
-
125
-
126
-
127
-
128
-
129
-
130
-
131
-
132
-
133
-
134
-
135
-
136
-
137
-
138
-
139
-
140
-
141
-
142
-
143
-
144
-
145
-
146
-
147
-
148
-
149
-
150
-
151
-
152
-
153
-
154
-
155
-
156
-
157
-
158
-
159
-
160
-
161
-
162
-
163
-
164
-
165
-
166
-
167
-
168
-
169
-
170
-
171
-
172
-
173
-
174
-
175
-
176
-
177
-
178
-
179
-
180
-
181
-
182
-
183
-
184
-
185
-
186
-
187
-
188
-
189
-
190
-
191
-
192
-
193
-
194
-
195
-
196
-
197
-
198
-
199
-
200
-
201
-
202
-
203
-
204
-
205
-
206
-
207
-
208
-
209
-
210
-
211
-
212
-
213
-
214
-
215
-
216
-
217
-
218
-
219
-
220
-
221
-
222
-
223
-
224
-
225
-
226
-
227
-
228
-
229
-
230
-
231
-
232
-
233
-
234
-
235
-
236
-
237
-
238
-
239
-
240
-
241
-
242
-
243
-
244
-
245
-
246
-
247
-
248
-
249
-
250
-
251
-
252
-
253
-
254
-
255
-
256
-
257
-
258
-
259
-
260
-
261
-
262
-
263
-
264
-
265
-
266
-
267
-
268
-
269
-
270
-
271
-
272
-
273
-
274
-
275
-
276
-
277
-
278
-
279
-
280
-
281
-
282
-
283
-
284
-
285
-
286
-
287
-
288
-
289
-
290
-
291
-
292
-
293
-
294
-
295
 |
 |
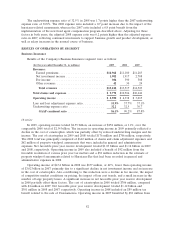
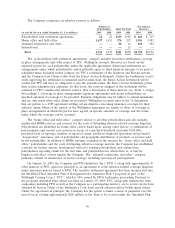
development totaled $168 million and $274 million in 2009 and 2008, respectively. The cost of
catastrophes totaled $3 million and $84 million in 2009 and 2008, respectively.
Operating income of $649 million in 2008 decreased by $26 million, or 4%, from 2007. The decline
in operating income was primarily driven by an increase in the number of large losses that exceeded
expectations within the International group, an increase in the cost of catastrophes and a decline in net
investment income, largely offset by a significant increase in net favorable prior year reserve
development. The cost of catastrophes in 2008 was $84 million, compared with no catastrophe losses in
2007. Net favorable prior year reserve development totaled $274 and $93 million in 2008 and 2007,
respectively.
In March 2007, the Company completed the sale of Afianzadora Insurgentes, which accounted for
$25 million of net written premiums for the year ended December 31, 2007. The impact of this
transaction was not material to the Company’s results of operations or financial position.
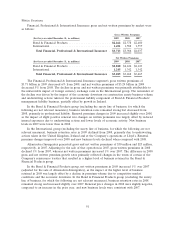
Earned Premiums
Earned premiums of $3.33 billion in 2009 declined $96 million, or 3%, from the 2008 total due to
the unfavorable impact of foreign currency exchange rates. Adjusting for the impact of exchange rates,
earned premiums in this segment were slightly higher than in 2008, primarily reflecting growth in the
International group. Earned premiums of $3.43 billion in 2008 increased $45 million, or 1%, over the
2007 total of $3.38 billion. Adjusting for the sale of Afianzadora Insurgentes in 2007, earned premium
growth of 2% in 2008 was concentrated in the Construction Services business unit of the Bond &
Financial Products group due to changes in the terms of certain reinsurance treaties that resulted in a
higher level of business retained.
Net Investment Income
The slight decline in net investment income in 2009 compared with 2008 was primarily driven by
the unfavorable impact of foreign currency exchange rates, which reduced reported net investment
income by approximately $18 million in 2009. Refer to the ‘‘Net Investment Income’’ section of
‘‘Consolidated Results of Operations’’ herein for a discussion of the change in the Company’s net
investment income in 2009 and 2008 as compared with the respective prior years, as well as a
discussion of the Company’s net investment income allocation methodology.
Claims and Expenses
Claims and claim adjustment expenses in 2009 totaled $1.75 billion, a decrease of $22 million, or
1%, from 2008. The decrease in 2009 was driven by a $73 million favorable impact of foreign currency
exchange rates. A decrease in net favorable prior year reserve development was largely offset by
declines in the cost of catastrophes and large losses in the International group. Net favorable prior year
reserve development totaled $168 million and $274 million in 2009 and 2008, respectively. Net
favorable prior year reserve development in 2009 was driven by better than expected loss experience in
the International group, particularly in the United Kingdom and in the Surety line of business in
Canada. In addition, the Aviation and Property lines of business at Lloyd’s experienced net favorable
prior year reserve development in 2009. In the Bond & Financial Products group, better than expected
loss experience for the contract surety business within the fidelity and surety product line for recent
accident years also resulted in net favorable prior year reserve development in 2009. The cost of
catastrophes included in claims and claim adjustment expenses in 2009 totaled $3 million, compared
with $73 million in 2008.
Claims and claim adjustment expenses of $1.77 billion in 2008 increased by $32 million, or 2%,
over 2007. An increase in the cost of catastrophes and an increase in the number of large losses that
exceeded expectations within International in 2008 were largely offset by a significant increase in net
favorable prior year reserve development. The cost of catastrophes included in claims and claim
89