Travelers 2009 Annual Report Download - page 2
Download and view the complete annual report
Please find page 2 of the 2009 Travelers annual report below. You can navigate through the pages in the report by either clicking on the pages listed below, or by using the keyword search tool below to find specific information within the annual report.-
 1
1 -
 2
2 -
 3
3 -
 4
4 -
 5
5 -
 6
6 -
 7
7 -
 8
8 -
 9
9 -
 10
10 -
 11
11 -
 12
12 -
 13
13 -
14
-
15
-
16
-
17
-
18
-
19
-
20
-
21
-
22
-
23
-
24
-
25
-
26
-
27
-
28
-
29
-
30
-
31
-
32
-
33
-
34
-
35
-
36
-
37
-
38
-
39
-
40
-
41
-
42
-
43
-
44
-
45
-
46
-
47
-
48
-
49
-
50
-
51
-
52
-
53
-
54
-
55
-
56
-
57
-
58
-
59
-
60
-
61
-
62
-
63
-
64
-
65
-
66
-
67
-
68
-
69
-
70
-
71
-
72
-
73
-
74
-
75
-
76
-
77
-
78
-
79
-
80
-
81
-
82
-
83
-
84
-
85
-
86
-
87
-
88
-
89
-
90
-
91
-
92
-
93
-
94
-
95
-
96
-
97
-
98
-
99
-
100
-
101
-
102
-
103
-
104
-
105
-
106
-
107
-
108
-
109
-
110
-
111
-
112
-
113
-
114
-
115
-
116
-
117
-
118
-
119
-
120
-
121
-
122
-
123
-
124
-
125
-
126
-
127
-
128
-
129
-
130
-
131
-
132
-
133
-
134
-
135
-
136
-
137
-
138
-
139
-
140
-
141
-
142
-
143
-
144
-
145
-
146
-
147
-
148
-
149
-
150
-
151
-
152
-
153
-
154
-
155
-
156
-
157
-
158
-
159
-
160
-
161
-
162
-
163
-
164
-
165
-
166
-
167
-
168
-
169
-
170
-
171
-
172
-
173
-
174
-
175
-
176
-
177
-
178
-
179
-
180
-
181
-
182
-
183
-
184
-
185
-
186
-
187
-
188
-
189
-
190
-
191
-
192
-
193
-
194
-
195
-
196
-
197
-
198
-
199
-
200
-
201
-
202
-
203
-
204
-
205
-
206
-
207
-
208
-
209
-
210
-
211
-
212
-
213
-
214
-
215
-
216
-
217
-
218
-
219
-
220
-
221
-
222
-
223
-
224
-
225
-
226
-
227
-
228
-
229
-
230
-
231
-
232
-
233
-
234
-
235
-
236
-
237
-
238
-
239
-
240
-
241
-
242
-
243
-
244
-
245
-
246
-
247
-
248
-
249
-
250
-
251
-
252
-
253
-
254
-
255
-
256
-
257
-
258
-
259
-
260
-
261
-
262
-
263
-
264
-
265
-
266
-
267
-
268
-
269
-
270
-
271
-
272
-
273
-
274
-
275
-
276
-
277
-
278
-
279
-
280
-
281
-
282
-
283
-
284
-
285
-
286
-
287
-
288
-
289
-
290
-
291
-
292
-
293
-
294
-
295
 |
 |

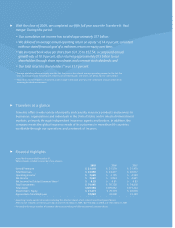
With the close of 2009, we completed our fifth full year since the Travelers-St. Paul
merger. During this period:
• Our cumulative net income has totaled approximately $17 billion;
• We delivered an average annual operating return on equity* of 14.4 percent, consistent
with our stated financial goal of a mid-teens return on equity over time;
• We increased book value per share from $31.35 to $52.54, a compound annual
growth rate of 10.9 percent, after returning approximately $13 billion to our
shareholders through share repurchases and common stock dividends; and
• Our total return to shareholders** was 51.7 percent.
Travelers at a glance
Travelers offers a wide variety of property and casualty insurance products and services to
businesses, organizations and individuals in the United States and in selected international
markets, primarily through independent insurance agents and brokers. In addition, the
company meets the global insurance needs of its customers in more than 90 countries
worldwide through our operations and a network of insurers.
1 Operating income equals net income excluding the after-tax impact of net realized investment gains (losses).
After-tax net realized investment gains (losses) were $22 million in 2009, $(271) million in 2008 and $101 million in 2007.
2 Per weighted average number of common shares outstanding and dilutive potential common shares.
Financial Highlights
At and for the year ended December 31,
Dollar amounts in millions, except per share amounts.
2009 2008 2007
Earned Premiums $ 21,418 $ 21,579 $ 21,470
Total Revenues $ 24,680 $ 24,477 $ 26,017
Operating Income1 $ 3,600 $ 3,195 $ 4,500
Net Income $ 3,622 $ 2,924 $ 4,601
Net Income Per Diluted Common Share2 $ 6.33 $ 4.81 $ 6.85
Total Investments $ 74,965 $ 70,738 $ 74,818
Total Assets $109,560 $109,632 $115,224
Shareholders’ Equity $ 27,415 $ 25,319 $ 26,616
Approximate Total Employees 32,000 33,000 33,300
* Average operating return on equity over the last five years is the ratio of average operating income for the last five
years to average equity excluding net realized and unrealized gains and losses, net of tax, for the same period.
** Total return to shareholders is measured as the change in the stock price plus the cumulative amount of dividends,
assuming dividend reinvestment.
785_Travelers09AR_Cvr_16g.indd 2 2/22/10 5:34:45PM