Travelers 2009 Annual Report Download - page 173
Download and view the complete annual report
Please find page 173 of the 2009 Travelers annual report below. You can navigate through the pages in the report by either clicking on the pages listed below, or by using the keyword search tool below to find specific information within the annual report.-
 1
1 -
2
-
3
-
4
-
5
-
6
-
7
-
8
-
9
-
10
-
11
-
12
-
13
-
14
-
15
-
16
-
17
-
18
-
19
-
20
-
21
-
22
-
23
-
24
-
25
-
26
-
27
-
28
-
29
-
30
-
31
-
32
-
33
-
34
-
35
-
36
-
37
-
38
-
39
-
40
-
41
-
42
-
43
-
44
-
45
-
46
-
47
-
48
-
49
-
50
-
51
-
52
-
53
-
54
-
55
-
56
-
57
-
58
-
59
-
60
-
61
-
62
-
63
-
64
-
65
-
66
-
67
-
68
-
69
-
70
-
71
-
72
-
73
-
74
-
75
-
76
-
77
-
78
-
79
-
80
-
81
-
82
-
83
-
84
-
85
-
86
-
87
-
88
-
89
-
90
-
91
-
92
-
93
-
94
-
95
-
96
-
97
-
98
-
99
-
100
-
101
-
102
-
103
-
104
-
105
-
106
-
107
-
108
-
109
-
110
-
111
-
112
-
113
-
114
-
115
-
116
-
117
-
118
-
119
-
120
-
121
-
122
-
123
-
124
-
125
-
126
-
127
-
128
-
129
-
130
-
131
-
132
-
133
-
134
-
135
-
136
-
137
-
138
-
139
-
140
-
141
-
142
-
143
-
144
-
145
-
146
-
147
-
148
-
149
-
150
-
151
-
152
-
153
-
154
-
155
-
156
-
157
-
158
-
159
-
160
-
161
-
162
-
 163
163 -
 164
164 -
 165
165 -
 166
166 -
 167
167 -
 168
168 -
 169
169 -
 170
170 -
 171
171 -
 172
172 -
 173
173 -
 174
174 -
 175
175 -
 176
176 -
 177
177 -
 178
178 -
 179
179 -
 180
180 -
 181
181 -
 182
182 -
 183
183 -
184
-
185
-
186
-
187
-
188
-
189
-
190
-
191
-
192
-
193
-
194
-
195
-
196
-
197
-
198
-
199
-
200
-
201
-
202
-
203
-
204
-
205
-
206
-
207
-
208
-
209
-
210
-
211
-
212
-
213
-
214
-
215
-
216
-
217
-
218
-
219
-
220
-
221
-
222
-
223
-
224
-
225
-
226
-
227
-
228
-
229
-
230
-
231
-
232
-
233
-
234
-
235
-
236
-
237
-
238
-
239
-
240
-
241
-
242
-
243
-
244
-
245
-
246
-
247
-
248
-
249
-
250
-
251
-
252
-
253
-
254
-
255
-
256
-
257
-
258
-
259
-
260
-
261
-
262
-
263
-
264
-
265
-
266
-
267
-
268
-
269
-
270
-
271
-
272
-
273
-
274
-
275
-
276
-
277
-
278
-
279
-
280
-
281
-
282
-
283
-
284
-
285
-
286
-
287
-
288
-
289
-
290
-
291
-
292
-
293
-
294
-
295
 |
 |

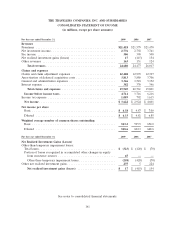
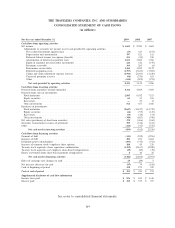
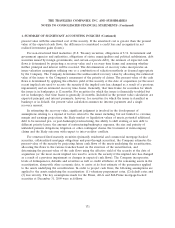
THE TRAVELERS COMPANIES, INC. AND SUBSIDIARIES
CONSOLIDATED STATEMENT OF INCOME
(in millions, except per share amounts)
For the year ended December 31, 2009 2008 2007
Revenues
Premiums .............................................. $21,418 $21,579 $21,470
Net investment income..................................... 2,776 2,792 3,761
Fee income ............................................. 306 390 508
Net realized investment gains (losses) . . . . . . . . . . . . . . . . . . . . . . . . . . 17 (415) 154
Other revenues .......................................... 163 131 124
Total revenues ........................................ 24,680 24,477 26,017
Claims and expenses
Claims and claim adjustment expenses . . . . . . . . . . . . . . . . . . . . . . . . . . 12,408 12,993 12,397
Amortization of deferred acquisition costs . . . . . . . . . . . . . . . . . . . . . . . 3,813 3,880 3,706
General and administrative expenses . . . . . . . . . . . . . . . . . . . . . . . . . . . 3,366 3,518 3,352
Interest expense.......................................... 382 370 346
Total claims and expenses ............................... 19,969 20,761 19,801
Income before income taxes ................................ 4,711 3,716 6,216
Income tax expense ....................................... 1,089 792 1,615
Net income ............................................ $ 3,622 $ 2,924 $ 4,601
Net income per share
Basic ................................................ $ 6.38 $ 4.87 $ 7.00
Diluted .............................................. $ 6.33 $ 4.81 $ 6.85
Weighted average number of common shares outstanding
Basic ................................................ 563.2 595.9 652.0
Diluted .............................................. 568.6 604.3 668.6
For the year ended December 31, 2009 2008 2007
Net Realized Investment Gains (Losses)
Other-than-temporary impairment losses:
Total losses............................................ $ (323) $ (420) $ (70)
Portion of losses recognized in accumulated other changes in equity
from nonowner sources ................................. 65 ——
Other-than-temporary impairment losses . . . . . . . . . . . . . . . . . . . . . (258) (420) (70)
Other net realized investment gains . . . . . . . . . . . . . . . . . . . . . . . . . . . . 275 5 224
Net realized investment gains (losses) ...................... $17$ (415) $ 154
See notes to consolidated financial statements.
161