Travelers 2009 Annual Report Download - page 197
Download and view the complete annual report
Please find page 197 of the 2009 Travelers annual report below. You can navigate through the pages in the report by either clicking on the pages listed below, or by using the keyword search tool below to find specific information within the annual report.-
 1
1 -
2
-
3
-
4
-
5
-
6
-
7
-
8
-
9
-
10
-
11
-
12
-
13
-
14
-
15
-
16
-
17
-
18
-
19
-
20
-
21
-
22
-
23
-
24
-
25
-
26
-
27
-
28
-
29
-
30
-
31
-
32
-
33
-
34
-
35
-
36
-
37
-
38
-
39
-
40
-
41
-
42
-
43
-
44
-
45
-
46
-
47
-
48
-
49
-
50
-
51
-
52
-
53
-
54
-
55
-
56
-
57
-
58
-
59
-
60
-
61
-
62
-
63
-
64
-
65
-
66
-
67
-
68
-
69
-
70
-
71
-
72
-
73
-
74
-
75
-
76
-
77
-
78
-
79
-
80
-
81
-
82
-
83
-
84
-
85
-
86
-
87
-
88
-
89
-
90
-
91
-
92
-
93
-
94
-
95
-
96
-
97
-
98
-
99
-
100
-
101
-
102
-
103
-
104
-
105
-
106
-
107
-
108
-
109
-
110
-
111
-
112
-
113
-
114
-
115
-
116
-
117
-
118
-
119
-
120
-
121
-
122
-
123
-
124
-
125
-
126
-
127
-
128
-
129
-
130
-
131
-
132
-
133
-
134
-
135
-
136
-
137
-
138
-
139
-
140
-
141
-
142
-
143
-
144
-
145
-
146
-
147
-
148
-
149
-
150
-
151
-
152
-
153
-
154
-
155
-
156
-
157
-
158
-
159
-
160
-
161
-
162
-
163
-
164
-
165
-
166
-
167
-
168
-
169
-
170
-
171
-
172
-
173
-
174
-
175
-
176
-
177
-
178
-
179
-
180
-
181
-
182
-
183
-
184
-
185
-
186
-
 187
187 -
 188
188 -
 189
189 -
 190
190 -
 191
191 -
 192
192 -
 193
193 -
 194
194 -
 195
195 -
 196
196 -
 197
197 -
 198
198 -
 199
199 -
 200
200 -
 201
201 -
 202
202 -
 203
203 -
 204
204 -
 205
205 -
 206
206 -
 207
207 -
208
-
209
-
210
-
211
-
212
-
213
-
214
-
215
-
216
-
217
-
218
-
219
-
220
-
221
-
222
-
223
-
224
-
225
-
226
-
227
-
228
-
229
-
230
-
231
-
232
-
233
-
234
-
235
-
236
-
237
-
238
-
239
-
240
-
241
-
242
-
243
-
244
-
245
-
246
-
247
-
248
-
249
-
250
-
251
-
252
-
253
-
254
-
255
-
256
-
257
-
258
-
259
-
260
-
261
-
262
-
263
-
264
-
265
-
266
-
267
-
268
-
269
-
270
-
271
-
272
-
273
-
274
-
275
-
276
-
277
-
278
-
279
-
280
-
281
-
282
-
283
-
284
-
285
-
286
-
287
-
288
-
289
-
290
-
291
-
292
-
293
-
294
-
295
 |
 |

THE TRAVELERS COMPANIES, INC. AND SUBSIDIARIES
NOTES TO CONSOLIDATED FINANCIAL STATEMENTS (Continued)
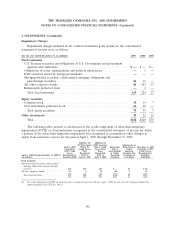
2. SEGMENT INFORMATION (Continued)
loss in 2009 included a benefit of $28 million from the favorable resolution of various prior year
tax matters. The operating loss in 2007 included a benefit of $52 million from the favorable
resolution of various prior year tax matters and an after-tax loss of $25 million related to the
Company’s redemption of its 4.50% contingently convertible debentures.
(at December 31, in millions) 2009 2008
Asset reconciliation:
Business Insurance............................... $ 81,705 $ 82,503
Financial, Professional & International Insurance . . . . . . . . 13,920 13,356
Personal Insurance............................... 13,328 13,151
Total assets for reportable segments . . . . . . . . . . . . . . . . . 108,953 109,010
Other assets(1) ................................. 607 622
Total consolidated assets . . . . . . . . . . . . . . . . . . . . . . . $109,560 $109,632
(1) The major components of other assets in 2009 and 2008 were other intangible assets and
deferred taxes.
Enterprise-Wide Disclosures
Revenues from internal customers for the years ended December 31, 2009, 2008 and 2007 were not
material. Foreign assets at December 31, 2009 and 2008 also were not material. The Company does not
have revenue from transactions with a single customer amounting to 10 percent or more of its
revenues.
The following table presents revenues of the Company’s operations based on location:
(for the year ended December 31, in millions) 2009 2008 2007
U.S. ..................................... $23,272 $22,809 $24,413
Non-U.S. ................................. 1,408 1,668 1,604
Total revenues ............................ $24,680 $24,477 $26,017
185