Travelers 2009 Annual Report Download - page 97
Download and view the complete annual report
Please find page 97 of the 2009 Travelers annual report below. You can navigate through the pages in the report by either clicking on the pages listed below, or by using the keyword search tool below to find specific information within the annual report.-
 1
1 -
2
-
3
-
4
-
5
-
6
-
7
-
8
-
9
-
10
-
11
-
12
-
13
-
14
-
15
-
16
-
17
-
18
-
19
-
20
-
21
-
22
-
23
-
24
-
25
-
26
-
27
-
28
-
29
-
30
-
31
-
32
-
33
-
34
-
35
-
36
-
37
-
38
-
39
-
40
-
41
-
42
-
43
-
44
-
45
-
46
-
47
-
48
-
49
-
50
-
51
-
52
-
53
-
54
-
55
-
56
-
57
-
58
-
59
-
60
-
61
-
62
-
63
-
64
-
65
-
66
-
67
-
68
-
69
-
70
-
71
-
72
-
73
-
74
-
75
-
76
-
77
-
78
-
79
-
80
-
81
-
82
-
83
-
84
-
85
-
86
-
 87
87 -
 88
88 -
 89
89 -
 90
90 -
 91
91 -
 92
92 -
 93
93 -
 94
94 -
 95
95 -
 96
96 -
 97
97 -
 98
98 -
 99
99 -
 100
100 -
 101
101 -
 102
102 -
 103
103 -
 104
104 -
 105
105 -
 106
106 -
 107
107 -
108
-
109
-
110
-
111
-
112
-
113
-
114
-
115
-
116
-
117
-
118
-
119
-
120
-
121
-
122
-
123
-
124
-
125
-
126
-
127
-
128
-
129
-
130
-
131
-
132
-
133
-
134
-
135
-
136
-
137
-
138
-
139
-
140
-
141
-
142
-
143
-
144
-
145
-
146
-
147
-
148
-
149
-
150
-
151
-
152
-
153
-
154
-
155
-
156
-
157
-
158
-
159
-
160
-
161
-
162
-
163
-
164
-
165
-
166
-
167
-
168
-
169
-
170
-
171
-
172
-
173
-
174
-
175
-
176
-
177
-
178
-
179
-
180
-
181
-
182
-
183
-
184
-
185
-
186
-
187
-
188
-
189
-
190
-
191
-
192
-
193
-
194
-
195
-
196
-
197
-
198
-
199
-
200
-
201
-
202
-
203
-
204
-
205
-
206
-
207
-
208
-
209
-
210
-
211
-
212
-
213
-
214
-
215
-
216
-
217
-
218
-
219
-
220
-
221
-
222
-
223
-
224
-
225
-
226
-
227
-
228
-
229
-
230
-
231
-
232
-
233
-
234
-
235
-
236
-
237
-
238
-
239
-
240
-
241
-
242
-
243
-
244
-
245
-
246
-
247
-
248
-
249
-
250
-
251
-
252
-
253
-
254
-
255
-
256
-
257
-
258
-
259
-
260
-
261
-
262
-
263
-
264
-
265
-
266
-
267
-
268
-
269
-
270
-
271
-
272
-
273
-
274
-
275
-
276
-
277
-
278
-
279
-
280
-
281
-
282
-
283
-
284
-
285
-
286
-
287
-
288
-
289
-
290
-
291
-
292
-
293
-
294
-
295
 |
 |
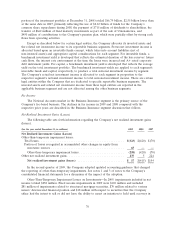
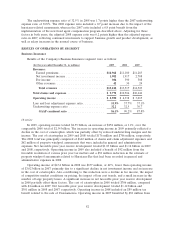
The amortization of deferred acquisition costs totaled $1.78 billion in 2009, $43 million lower than
the comparable total of $1.82 billion in 2008. The decline was consistent with the declines in earned
premiums. The amortization of deferred acquisition costs totaled $1.82 billion in 2008, $76 million, or
4%, higher than the comparable total of $1.74 billion in 2007. The growth in amortization costs
primarily reflected the higher level of amortized commission expense in 2008 resulting from the
Company’s implementation of a new fixed agent compensation program in 2007.
General and administrative expenses in 2009 totaled $1.97 billion, $113 million lower than the
comparable 2008 total of $2.08 billion. The majority of the decrease reflected the impact of estimates
of windpool assessments related to Hurricane Ike in each year. During 2008, the Company recorded
$62 million of hurricane-related assessments in general and administrative expenses. Subsequently,
during the first half of 2009, the Company recorded a $38 million reduction in these assessments due to
a decline in estimated insurance industry losses related to Hurricane Ike. General and administrative
expenses totaled $2.08 billion in 2008, an increase of $51 million, or 3%, over the comparable 2007
total of $2.03 billion. The increase in 2008 primarily reflected the impact of hurricane-related
assessments.
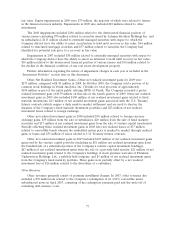
GAAP Combined Ratio
In 2009, the loss and loss adjustment expense ratio of 53.9% was 3.8 points lower than the
comparable 2008 ratio of 57.7%. The cost of catastrophes in 2009 and 2008 accounted for 1.6 points
and 5.7 points of the loss and loss adjustment expense ratio, respectively. Net favorable prior year
reserve development provided 9.3 point and 10.0 point benefits to the loss and loss adjustment expense
ratio in 2009 and 2008, respectively. The loss and loss adjustment expense ratio in 2009 adjusted for the
cost of catastrophes and prior year reserve development was 0.4 points lower than the 2008 ratio on the
same basis, due to lower non-catastrophe weather-related losses and fewer large property losses,
partially offset by reduced underwriting margins related to pricing and loss cost trends.
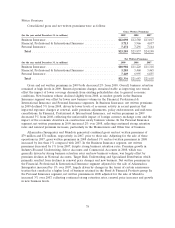
The loss and loss adjustment expense ratio in 2008 of 57.7% was 0.6 points higher than the
comparable 2007 ratio of 57.1%. The cost of catastrophes accounted for 5.7 points of the loss and loss
adjustment expense ratio in 2008, compared with no impact from catastrophes in 2007. Net favorable
prior year reserve development provided 10.0 point and 2.6 point benefits to the loss and loss
adjustment expense ratio in 2008 and 2007, respectively. The 2008 loss and loss adjustment expense
ratio adjusted for the cost of catastrophes and prior year reserve development was 2.3 points higher
than the 2007 ratio on the same basis, reflecting the impact of competitive market conditions on pricing
over the preceding twelve months and loss cost trends, as well as a small increase in the number of
large property losses.
The underwriting expense ratio of 32.2% in 2009 was 0.3 points lower than the underwriting
expense ratio of 32.5% in 2008. The 2009 underwriting expense ratio included a 0.3 point benefit from
the reduction in the estimate of windpool assessments described above, whereas the underwriting
expense ratio in 2008 included a 0.6 point increase due to the impact from the windpool assessments
and reinstatement premiums. Adjusting for these factors in both years, the underwriting expense ratio
for 2009 was 0.6 points higher than the 2008 underwriting expense ratio. The adjusted underwriting
expense ratio in 2009 reflected the unfavorable impact of the decline in fee income compared with the
same periods of 2008. A portion of fee income is accounted for as a reduction of expenses for purposes
of calculating the expense ratio.
The underwriting expense ratio of 32.5% in 2008 was 1.8 points higher than the comparable 2007
ratio of 30.7%. The 2008 expense ratio included a 0.6 point impact of the hurricane-related
assessments, whereas the 2007 ratio included a 0.7 point benefit from the implementation of the new
fixed agent compensation program described in the ‘‘Consolidated Overview’’ section herein. Adjusting
for these factors in both years, the adjusted 2008 expense ratio was 0.5 points higher than the adjusted
85