Travelers 2009 Annual Report Download - page 21
Download and view the complete annual report
Please find page 21 of the 2009 Travelers annual report below. You can navigate through the pages in the report by either clicking on the pages listed below, or by using the keyword search tool below to find specific information within the annual report.-
 1
1 -
2
-
3
-
4
-
5
-
6
-
7
-
8
-
9
-
10
-
 11
11 -
 12
12 -
 13
13 -
 14
14 -
 15
15 -
 16
16 -
 17
17 -
 18
18 -
 19
19 -
 20
20 -
 21
21 -
 22
22 -
 23
23 -
 24
24 -
 25
25 -
 26
26 -
 27
27 -
 28
28 -
 29
29 -
 30
30 -
 31
31 -
32
-
33
-
34
-
35
-
36
-
37
-
38
-
39
-
40
-
41
-
42
-
43
-
44
-
45
-
46
-
47
-
48
-
49
-
50
-
51
-
52
-
53
-
54
-
55
-
56
-
57
-
58
-
59
-
60
-
61
-
62
-
63
-
64
-
65
-
66
-
67
-
68
-
69
-
70
-
71
-
72
-
73
-
74
-
75
-
76
-
77
-
78
-
79
-
80
-
81
-
82
-
83
-
84
-
85
-
86
-
87
-
88
-
89
-
90
-
91
-
92
-
93
-
94
-
95
-
96
-
97
-
98
-
99
-
100
-
101
-
102
-
103
-
104
-
105
-
106
-
107
-
108
-
109
-
110
-
111
-
112
-
113
-
114
-
115
-
116
-
117
-
118
-
119
-
120
-
121
-
122
-
123
-
124
-
125
-
126
-
127
-
128
-
129
-
130
-
131
-
132
-
133
-
134
-
135
-
136
-
137
-
138
-
139
-
140
-
141
-
142
-
143
-
144
-
145
-
146
-
147
-
148
-
149
-
150
-
151
-
152
-
153
-
154
-
155
-
156
-
157
-
158
-
159
-
160
-
161
-
162
-
163
-
164
-
165
-
166
-
167
-
168
-
169
-
170
-
171
-
172
-
173
-
174
-
175
-
176
-
177
-
178
-
179
-
180
-
181
-
182
-
183
-
184
-
185
-
186
-
187
-
188
-
189
-
190
-
191
-
192
-
193
-
194
-
195
-
196
-
197
-
198
-
199
-
200
-
201
-
202
-
203
-
204
-
205
-
206
-
207
-
208
-
209
-
210
-
211
-
212
-
213
-
214
-
215
-
216
-
217
-
218
-
219
-
220
-
221
-
222
-
223
-
224
-
225
-
226
-
227
-
228
-
229
-
230
-
231
-
232
-
233
-
234
-
235
-
236
-
237
-
238
-
239
-
240
-
241
-
242
-
243
-
244
-
245
-
246
-
247
-
248
-
249
-
250
-
251
-
252
-
253
-
254
-
255
-
256
-
257
-
258
-
259
-
260
-
261
-
262
-
263
-
264
-
265
-
266
-
267
-
268
-
269
-
270
-
271
-
272
-
273
-
274
-
275
-
276
-
277
-
278
-
279
-
280
-
281
-
282
-
283
-
284
-
285
-
286
-
287
-
288
-
289
-
290
-
291
-
292
-
293
-
294
-
295
 |
 |

generally retains its workers’ compensation exposures. Reinsurance treaties often have aggregate limits
or caps which may result in larger net per risk retentions if the aggregate limits or caps are reached.
The Company utilizes facultative reinsurance to provide additional limits capacity or to reduce
retentions on an individual risk basis. The Company may also retain amounts greater than those
described herein based upon the individual characteristics of the risk.
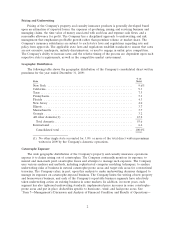
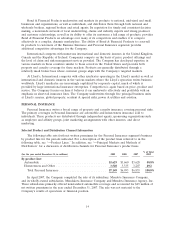
Geographic Distribution
The following table shows the geographic distribution of Business Insurance’s direct written
premiums for the states that accounted for the majority of premium volume for the year ended
December 31, 2009:
% of
State Total
California.................................................. 12.7%
New York ................................................. 7.9
Texas..................................................... 7.7
Illinois.................................................... 4.6
Florida ................................................... 4.5
Pennsylvania................................................ 4.3
New Jersey ................................................ 3.7
Massachusetts .............................................. 3.7
All others(1) ............................................... 50.9
Total ................................................... 100.0%
(1) No other single state accounted for 3.0% or more of the total direct written premiums
written in 2009 by the Business Insurance segment.
Competition
The insurance industry is represented in the commercial marketplace by many insurance
companies of varying size as well as other entities offering risk alternatives such as self-insured
retentions or captive programs. Market competition works within the insurance regulatory framework to
set the price charged for insurance products and the level of service provided. A company’s success in
the competitive commercial insurance landscape is largely measured by its ability to provide insurance
and services, including claims handling and risk control services, at a price and on terms that are
reasonable and acceptable to the customer, as well as its ability to retain existing customers and to
attract new customers.
Select Accounts business is typically written through independent agents and, to a lesser extent,
regional brokers and direct writers. Both national and regional property and casualty insurance
companies compete in the Select Accounts market which generally comprises lower hazard, ‘‘main
street’’ business customers. Risks are underwritten and priced using standard industry practices and a
combination of proprietary and standard industry product offerings. Competition in this market is
primarily based on product offerings, service levels, ease of doing business and price. Select Accounts
has established a strong marketing relationship with its distribution network and has provided this
network with defined underwriting policies, a broad array of products, competitive prices and a highly
efficient, automated platform that significantly reduces the time period between quoting a price on a
policy and issuing that policy. In addition, the Company has established centralized service centers to
help agents perform many service functions, in return for a fee.
9