Travelers 2009 Annual Report Download - page 92
Download and view the complete annual report
Please find page 92 of the 2009 Travelers annual report below. You can navigate through the pages in the report by either clicking on the pages listed below, or by using the keyword search tool below to find specific information within the annual report.-
 1
1 -
2
-
3
-
4
-
5
-
6
-
7
-
8
-
9
-
10
-
11
-
12
-
13
-
14
-
15
-
16
-
17
-
18
-
19
-
20
-
21
-
22
-
23
-
24
-
25
-
26
-
27
-
28
-
29
-
30
-
31
-
32
-
33
-
34
-
35
-
36
-
37
-
38
-
39
-
40
-
41
-
42
-
43
-
44
-
45
-
46
-
47
-
48
-
49
-
50
-
51
-
52
-
53
-
54
-
55
-
56
-
57
-
58
-
59
-
60
-
61
-
62
-
63
-
64
-
65
-
66
-
67
-
68
-
69
-
70
-
71
-
72
-
73
-
74
-
75
-
76
-
77
-
78
-
79
-
80
-
81
-
 82
82 -
 83
83 -
 84
84 -
 85
85 -
 86
86 -
 87
87 -
 88
88 -
 89
89 -
 90
90 -
 91
91 -
 92
92 -
 93
93 -
 94
94 -
 95
95 -
 96
96 -
 97
97 -
 98
98 -
 99
99 -
 100
100 -
 101
101 -
 102
102 -
103
-
104
-
105
-
106
-
107
-
108
-
109
-
110
-
111
-
112
-
113
-
114
-
115
-
116
-
117
-
118
-
119
-
120
-
121
-
122
-
123
-
124
-
125
-
126
-
127
-
128
-
129
-
130
-
131
-
132
-
133
-
134
-
135
-
136
-
137
-
138
-
139
-
140
-
141
-
142
-
143
-
144
-
145
-
146
-
147
-
148
-
149
-
150
-
151
-
152
-
153
-
154
-
155
-
156
-
157
-
158
-
159
-
160
-
161
-
162
-
163
-
164
-
165
-
166
-
167
-
168
-
169
-
170
-
171
-
172
-
173
-
174
-
175
-
176
-
177
-
178
-
179
-
180
-
181
-
182
-
183
-
184
-
185
-
186
-
187
-
188
-
189
-
190
-
191
-
192
-
193
-
194
-
195
-
196
-
197
-
198
-
199
-
200
-
201
-
202
-
203
-
204
-
205
-
206
-
207
-
208
-
209
-
210
-
211
-
212
-
213
-
214
-
215
-
216
-
217
-
218
-
219
-
220
-
221
-
222
-
223
-
224
-
225
-
226
-
227
-
228
-
229
-
230
-
231
-
232
-
233
-
234
-
235
-
236
-
237
-
238
-
239
-
240
-
241
-
242
-
243
-
244
-
245
-
246
-
247
-
248
-
249
-
250
-
251
-
252
-
253
-
254
-
255
-
256
-
257
-
258
-
259
-
260
-
261
-
262
-
263
-
264
-
265
-
266
-
267
-
268
-
269
-
270
-
271
-
272
-
273
-
274
-
275
-
276
-
277
-
278
-
279
-
280
-
281
-
282
-
283
-
284
-
285
-
286
-
287
-
288
-
289
-
290
-
291
-
292
-
293
-
294
-
295
 |
 |
well as better than expected loss experience in certain lines of business within the Homeowners and
Other product line.
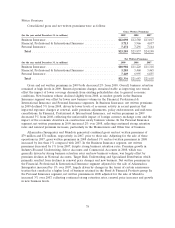
Each of the Company’s three business segments also experienced net favorable prior year reserve
development in 2007. In Business Insurance, net favorable prior year reserve development of
$301 million was primarily driven by better than expected loss development for recent accident years in
the commercial multi-peril, general liability, commercial automobile and property product lines. Net
prior year reserve development in 2007 in the Business Insurance segment included a $185 million
increase to environmental reserves. In the Financial, Professional & International Insurance segment,
net favorable prior year reserve development of $93 million in 2007 primarily reflected better than
expected loss development in international property, employers’ liability, professional indemnity and
motor lines of business for recent accident years. In the Personal Insurance segment, net favorable
prior year reserve development of $152 million in 2007 occurred in both the Automobile and
Homeowners and Other lines of business.
Factors contributing to net favorable prior year reserve development in each segment in 2009, 2008
and 2007 are discussed in more detail in the segment discussions that follow.
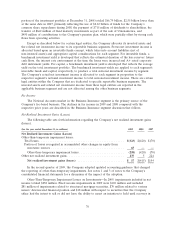
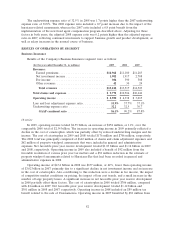
Amortization of Deferred Acquisition Costs
In 2009, the amortization of deferred acquisition costs totaled $3.81 billion, 2% lower than the
total of $3.88 billion in 2008. The decline in 2009 was consistent with the decline in earned premiums.
The amortization of deferred acquisition costs totaled $3.88 billion in 2008, $174 million, or 5%,
higher than the comparable 2007 total of $3.71 billion. The growth in amortization costs in 2008
primarily reflected the higher level of amortized commission expense resulting from the Company’s
implementation of a new fixed agent compensation program in 2007, described in more detail below.
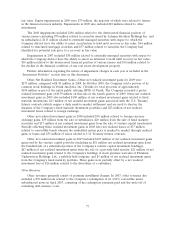
General and Administrative Expenses
General and administrative expenses totaled $3.37 billion in 2009, a decrease of $152 million, or
4%, from the comparable 2008 total of $3.52 billion. The decrease resulted from estimates of windpool
assessments related to Hurricane Ike. During 2008, the Company recorded $141 million of hurricane-
related assessments in general and administrative expenses. Subsequently, during the first half of 2009,
the Company recorded an $87 million reduction in these estimated assessments due to a decline in
estimated insurance industry losses related to Hurricane Ike. Adjusting for the impact of windpool
assessments in both 2009 and 2008, general and administrative expenses in 2009 increased 2% over
2008. The increase reflected the impact of continued investments to support business growth and
product development, including the Company’s direct to consumer initiative in the Personal Insurance
segment, partially offset by the favorable impact of changes in foreign currency exchange rates on
expenses in the Financial, Professional & International Insurance segment.
General and administrative expenses totaled $3.52 billion in 2008, an increase of $166 million, or
5%, over the comparable 2007 total of $3.35 billion. This increase primarily reflected the impact of
$141 million of hurricane-related assessments.
In the first quarter of 2007, the Company discontinued the use of contingent commissions and
implemented a new fixed agent compensation program for all of its personal insurance business. The
Company also offered the majority of its agents conducting commercial insurance business the option
to switch to this new program. The Company’s total payout rate for all agent compensation for 2007
was substantially the same as for 2006; however, the change to the new program created a difference in
the timing of commission expense recognition. The cost of the new program is required to be deferred
and amortized over the related policy period (generally six to twelve months), whereas the cost of the
contingent commission program was not subject to deferred acquisition cost accounting treatment and,
80