Travelers 2009 Annual Report Download - page 169
Download and view the complete annual report
Please find page 169 of the 2009 Travelers annual report below. You can navigate through the pages in the report by either clicking on the pages listed below, or by using the keyword search tool below to find specific information within the annual report.-
 1
1 -
2
-
3
-
4
-
5
-
6
-
7
-
8
-
9
-
10
-
11
-
12
-
13
-
14
-
15
-
16
-
17
-
18
-
19
-
20
-
21
-
22
-
23
-
24
-
25
-
26
-
27
-
28
-
29
-
30
-
31
-
32
-
33
-
34
-
35
-
36
-
37
-
38
-
39
-
40
-
41
-
42
-
43
-
44
-
45
-
46
-
47
-
48
-
49
-
50
-
51
-
52
-
53
-
54
-
55
-
56
-
57
-
58
-
59
-
60
-
61
-
62
-
63
-
64
-
65
-
66
-
67
-
68
-
69
-
70
-
71
-
72
-
73
-
74
-
75
-
76
-
77
-
78
-
79
-
80
-
81
-
82
-
83
-
84
-
85
-
86
-
87
-
88
-
89
-
90
-
91
-
92
-
93
-
94
-
95
-
96
-
97
-
98
-
99
-
100
-
101
-
102
-
103
-
104
-
105
-
106
-
107
-
108
-
109
-
110
-
111
-
112
-
113
-
114
-
115
-
116
-
117
-
118
-
119
-
120
-
121
-
122
-
123
-
124
-
125
-
126
-
127
-
128
-
129
-
130
-
131
-
132
-
133
-
134
-
135
-
136
-
137
-
138
-
139
-
140
-
141
-
142
-
143
-
144
-
145
-
146
-
147
-
148
-
149
-
150
-
151
-
152
-
153
-
154
-
155
-
156
-
157
-
158
-
 159
159 -
 160
160 -
 161
161 -
 162
162 -
 163
163 -
 164
164 -
 165
165 -
 166
166 -
 167
167 -
 168
168 -
 169
169 -
 170
170 -
 171
171 -
 172
172 -
 173
173 -
 174
174 -
 175
175 -
 176
176 -
 177
177 -
 178
178 -
 179
179 -
180
-
181
-
182
-
183
-
184
-
185
-
186
-
187
-
188
-
189
-
190
-
191
-
192
-
193
-
194
-
195
-
196
-
197
-
198
-
199
-
200
-
201
-
202
-
203
-
204
-
205
-
206
-
207
-
208
-
209
-
210
-
211
-
212
-
213
-
214
-
215
-
216
-
217
-
218
-
219
-
220
-
221
-
222
-
223
-
224
-
225
-
226
-
227
-
228
-
229
-
230
-
231
-
232
-
233
-
234
-
235
-
236
-
237
-
238
-
239
-
240
-
241
-
242
-
243
-
244
-
245
-
246
-
247
-
248
-
249
-
250
-
251
-
252
-
253
-
254
-
255
-
256
-
257
-
258
-
259
-
260
-
261
-
262
-
263
-
264
-
265
-
266
-
267
-
268
-
269
-
270
-
271
-
272
-
273
-
274
-
275
-
276
-
277
-
278
-
279
-
280
-
281
-
282
-
283
-
284
-
285
-
286
-
287
-
288
-
289
-
290
-
291
-
292
-
293
-
294
-
295
 |
 |
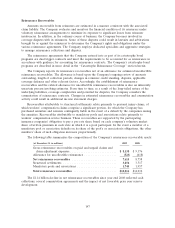
The primary market risk to the investment portfolio is interest rate and credit risk associated with
investments in fixed maturity securities. The portfolio duration relative to the liabilities’ duration is
primarily managed through cash market transactions and treasury futures transactions.
The Company’s tax-exempt fixed maturity investment portfolio totaled $40.84 billion and
$38.79 billion at December 31, 2009 and 2008, respectively. Federal and/or state tax legislation could be
enacted that would lessen or improve some or all of the tax advantages currently benefiting the
Company and result in an adverse or favorable impact on the value of these holdings.
The primary market risk for all of the Company’s debt is interest rate risk at the time of
refinancing. The Company monitors the interest rate environment and evaluates refinancing
opportunities as maturity dates approach. For additional information regarding the Company’s debt see
note 8 of notes to the Company’s consolidated financial statements as well as the ‘‘Liquidity and
Capital Resources’’ section of ‘‘Item 7—Management’s Discussion and Analysis of Financial Condition
and Results of Operations.’’
The Company’s foreign exchange market risk exposure is concentrated in the Company’s invested
assets and insurance reserves denominated in foreign currencies. Cash flows from the Company’s
foreign operations are the primary source of funds for the purchase of investments denominated in
foreign currencies. The Company purchases these investments primarily to fund insurance reserves and
other liabilities denominated in the same currency, effectively reducing its foreign currency exchange
rate exposure. Invested assets denominated in the British Pound Sterling comprised approximately 2.5%
and 2.3% of the total invested assets at December 31, 2009 and 2008, respectively. Invested assets
denominated in the Canadian dollar comprised approximately 2.1% of the total invested assets at
December 31, 2009 and 2008. Invested assets denominated in other currencies at December 31, 2009
and 2008 were not material.
There were no other significant changes in the Company’s primary market risk exposures or in
how those exposures were managed for the year ended December 31, 2009 compared to the year ended
December 31, 2008. The Company does not currently anticipate significant changes in its primary
market risk exposures or in how those exposures are managed in future reporting periods based upon
what is known or expected to be in effect in future reporting periods.
SENSITIVITY ANALYSIS
Sensitivity analysis is defined as the measurement of potential loss in future earnings, fair values or
cash flows of market sensitive instruments resulting from one or more selected hypothetical changes in
interest rates and other market rates or prices over a selected period of time. In the Company’s
sensitivity analysis model, a hypothetical change in market rates is selected that is expected to reflect
reasonably possible near-term changes in those rates. ‘‘Near-term’’ means a period of time going
forward up to one year from the date of the consolidated financial statements. Actual results may differ
from the hypothetical change in market rates assumed in this disclosure, especially since this sensitivity
analysis does not reflect the results of any actions that would be taken by the Company to mitigate
such hypothetical losses in fair value.
Interest Rate Risk
In this sensitivity analysis model, the Company uses fair values to measure its potential loss. The
sensitivity analysis model includes the following financial instruments entered into for purposes other
than trading: fixed maturities, non-redeemable preferred stocks, mortgage loans, short-term securities,
debt and derivative financial instruments. The primary market risk to the Company’s market sensitive
instruments is interest rate risk (inclusive of credit spreads). The sensitivity analysis model uses a 100
basis point change in interest rates to measure the hypothetical change in fair value of financial
instruments included in the model.
157