Travelers 2009 Annual Report Download - page 104
Download and view the complete annual report
Please find page 104 of the 2009 Travelers annual report below. You can navigate through the pages in the report by either clicking on the pages listed below, or by using the keyword search tool below to find specific information within the annual report.-
 1
1 -
2
-
3
-
4
-
5
-
6
-
7
-
8
-
9
-
10
-
11
-
12
-
13
-
14
-
15
-
16
-
17
-
18
-
19
-
20
-
21
-
22
-
23
-
24
-
25
-
26
-
27
-
28
-
29
-
30
-
31
-
32
-
33
-
34
-
35
-
36
-
37
-
38
-
39
-
40
-
41
-
42
-
43
-
44
-
45
-
46
-
47
-
48
-
49
-
50
-
51
-
52
-
53
-
54
-
55
-
56
-
57
-
58
-
59
-
60
-
61
-
62
-
63
-
64
-
65
-
66
-
67
-
68
-
69
-
70
-
71
-
72
-
73
-
74
-
75
-
76
-
77
-
78
-
79
-
80
-
81
-
82
-
83
-
84
-
85
-
86
-
87
-
88
-
89
-
90
-
91
-
92
-
93
-
 94
94 -
 95
95 -
 96
96 -
 97
97 -
 98
98 -
 99
99 -
 100
100 -
 101
101 -
 102
102 -
 103
103 -
 104
104 -
 105
105 -
 106
106 -
 107
107 -
 108
108 -
 109
109 -
 110
110 -
 111
111 -
 112
112 -
 113
113 -
 114
114 -
115
-
116
-
117
-
118
-
119
-
120
-
121
-
122
-
123
-
124
-
125
-
126
-
127
-
128
-
129
-
130
-
131
-
132
-
133
-
134
-
135
-
136
-
137
-
138
-
139
-
140
-
141
-
142
-
143
-
144
-
145
-
146
-
147
-
148
-
149
-
150
-
151
-
152
-
153
-
154
-
155
-
156
-
157
-
158
-
159
-
160
-
161
-
162
-
163
-
164
-
165
-
166
-
167
-
168
-
169
-
170
-
171
-
172
-
173
-
174
-
175
-
176
-
177
-
178
-
179
-
180
-
181
-
182
-
183
-
184
-
185
-
186
-
187
-
188
-
189
-
190
-
191
-
192
-
193
-
194
-
195
-
196
-
197
-
198
-
199
-
200
-
201
-
202
-
203
-
204
-
205
-
206
-
207
-
208
-
209
-
210
-
211
-
212
-
213
-
214
-
215
-
216
-
217
-
218
-
219
-
220
-
221
-
222
-
223
-
224
-
225
-
226
-
227
-
228
-
229
-
230
-
231
-
232
-
233
-
234
-
235
-
236
-
237
-
238
-
239
-
240
-
241
-
242
-
243
-
244
-
245
-
246
-
247
-
248
-
249
-
250
-
251
-
252
-
253
-
254
-
255
-
256
-
257
-
258
-
259
-
260
-
261
-
262
-
263
-
264
-
265
-
266
-
267
-
268
-
269
-
270
-
271
-
272
-
273
-
274
-
275
-
276
-
277
-
278
-
279
-
280
-
281
-
282
-
283
-
284
-
285
-
286
-
287
-
288
-
289
-
290
-
291
-
292
-
293
-
294
-
295
 |
 |

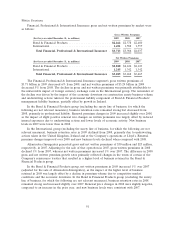
Net written premiums in the International group in 2008 were flat with 2007. For the International
group in 2008, business retention rates declined from 2007 due to the intentional non-renewal of
certain property business in Canada and more competitive market conditions at Lloyd’s. Renewal price
changes in 2008 were flat, compared to a decrease in 2007, and new business volume increased.
Personal Insurance
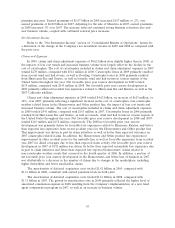
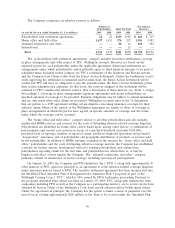
Results of the Company’s Personal Insurance segment were as follows:
(for the year ended December 31, in millions) 2009 2008 2007
Revenues:
Earned premiums ............................ $7,117 $6,970 $6,803
Net investment income ........................ 422 421 559
Other revenues.............................. 84 75 90
Total revenues ............................... $7,623 $7,466 $7,452
Total claims and expenses ........................ $6,824 $6,855 $5,996
Operating income .............................. $ 601 $ 465 $1,019
Loss and loss adjustment expense ratio . . . . . . . . . . . . . . 65.0% 66.2% 58.6%
Underwriting expense ratio . . . . . . . . . . . . . . . . . . . . . . . 29.6 30.8 28.2
GAAP combined ratio ......................... 94.6% 97.0% 86.8%
Incremental impact of direct to consumer initiative on
GAAP combined ratio ....................... 1.7% 0.5% —%
Overview
In 2009, operating income of $601 million was $136 million, or 29%, higher than in 2008, driven by
a decline in the cost of catastrophes and a reduction in the estimate of property windpool assessments,
partially offset by investments in the direct to consumer initiative and loss cost trends. The cost of
catastrophes in 2009 totaled $278 million, compared with $618 million in 2008. The 2008 total was
comprised of $541 million of claims and claim adjustment expenses and $77 million of property
windpool assessments that were included in general and administrative expenses. Net favorable prior
year reserve development in 2009 and 2008 totaled $135 million and $143 million, respectively.
Operating income of $465 million in 2008 was $554 million, or 54%, lower than operating income
in 2007, primarily reflecting an increase in the cost of catastrophes. Also contributing to the decline in
2008 were a reduction in net investment income, an increase in non-catastrophe related weather losses
and loss cost trends. The cost of catastrophes in 2008 totaled $618 million, compared with $163 million
in 2007. Net favorable prior year reserve development in 2008 and 2007 totaled $143 million and
$152 million, respectively. In addition, results in 2007 benefited by $71 million from the Company’s
implementation of a new fixed agent compensation program.
In April 2007, the Company completed the sale of its subsidiary, Mendota Insurance Company,
and its wholly-owned subsidiaries, Mendakota Insurance Company and Mendota Insurance Agency, Inc.
(collectively, Mendota). These subsidiaries primarily offered nonstandard automobile coverage and
accounted for $49 million of net written premiums in the year ended December 31, 2007. The impact
of this transaction was not material to the Company’s results of operations or financial position.
Earned Premiums
In 2009, earned premiums of $7.12 billion were $147 million, or 2%, higher than in 2008. The
increase reflected continued strong business retention rates and new business levels, and renewal
92