Travelers 2009 Annual Report Download - page 121
Download and view the complete annual report
Please find page 121 of the 2009 Travelers annual report below. You can navigate through the pages in the report by either clicking on the pages listed below, or by using the keyword search tool below to find specific information within the annual report.-
 1
1 -
2
-
3
-
4
-
5
-
6
-
7
-
8
-
9
-
10
-
11
-
12
-
13
-
14
-
15
-
16
-
17
-
18
-
19
-
20
-
21
-
22
-
23
-
24
-
25
-
26
-
27
-
28
-
29
-
30
-
31
-
32
-
33
-
34
-
35
-
36
-
37
-
38
-
39
-
40
-
41
-
42
-
43
-
44
-
45
-
46
-
47
-
48
-
49
-
50
-
51
-
52
-
53
-
54
-
55
-
56
-
57
-
58
-
59
-
60
-
61
-
62
-
63
-
64
-
65
-
66
-
67
-
68
-
69
-
70
-
71
-
72
-
73
-
74
-
75
-
76
-
77
-
78
-
79
-
80
-
81
-
82
-
83
-
84
-
85
-
86
-
87
-
88
-
89
-
90
-
91
-
92
-
93
-
94
-
95
-
96
-
97
-
98
-
99
-
100
-
101
-
102
-
103
-
104
-
105
-
106
-
107
-
108
-
109
-
110
-
 111
111 -
 112
112 -
 113
113 -
 114
114 -
 115
115 -
 116
116 -
 117
117 -
 118
118 -
 119
119 -
 120
120 -
 121
121 -
 122
122 -
 123
123 -
 124
124 -
 125
125 -
 126
126 -
 127
127 -
 128
128 -
 129
129 -
 130
130 -
 131
131 -
132
-
133
-
134
-
135
-
136
-
137
-
138
-
139
-
140
-
141
-
142
-
143
-
144
-
145
-
146
-
147
-
148
-
149
-
150
-
151
-
152
-
153
-
154
-
155
-
156
-
157
-
158
-
159
-
160
-
161
-
162
-
163
-
164
-
165
-
166
-
167
-
168
-
169
-
170
-
171
-
172
-
173
-
174
-
175
-
176
-
177
-
178
-
179
-
180
-
181
-
182
-
183
-
184
-
185
-
186
-
187
-
188
-
189
-
190
-
191
-
192
-
193
-
194
-
195
-
196
-
197
-
198
-
199
-
200
-
201
-
202
-
203
-
204
-
205
-
206
-
207
-
208
-
209
-
210
-
211
-
212
-
213
-
214
-
215
-
216
-
217
-
218
-
219
-
220
-
221
-
222
-
223
-
224
-
225
-
226
-
227
-
228
-
229
-
230
-
231
-
232
-
233
-
234
-
235
-
236
-
237
-
238
-
239
-
240
-
241
-
242
-
243
-
244
-
245
-
246
-
247
-
248
-
249
-
250
-
251
-
252
-
253
-
254
-
255
-
256
-
257
-
258
-
259
-
260
-
261
-
262
-
263
-
264
-
265
-
266
-
267
-
268
-
269
-
270
-
271
-
272
-
273
-
274
-
275
-
276
-
277
-
278
-
279
-
280
-
281
-
282
-
283
-
284
-
285
-
286
-
287
-
288
-
289
-
290
-
291
-
292
-
293
-
294
-
295
 |
 |

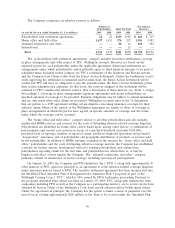
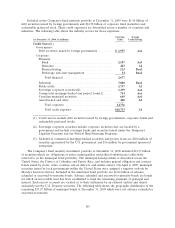
Impairment charges included in net realized investment gains (losses) were as follows:
(for the year ended December 31, in millions) 2009 2008 2007
Fixed maturities
U.S. Treasury securities and obligations of U.S. Government
and government agencies and authorities . . . . . . . . . . . . . . $— $— $—
Obligations of states, municipalities and political subdivisions . —1—
Debt securities issued by foreign governments . . . . . . . . . . . . ———
Mortgage-backed securities, collateralized mortgage
obligations and pass-through securities . . . . . . . . . . . . . . . . 81 36 —
All other corporate bonds . . . . . . . . . . . . . . . . . . . . . . . . . . . 88 283 37
Redeemable preferred stock . . . . . . . . . . . . . . . . . . . . . . . . . —4—
Total fixed maturities ............................ 169 324 37
Equity securities
Common stock................................... 15 34 7
Non-redeemable preferred stock . . . . . . . . . . . . . . . . . . . . . . 64 40 —
Total equity securities ............................ 79 74 7
Other investments .................................. 10 22 26
Total ........................................ $258 $420 $70
For the year ended December 31, 2009, the Company recognized the following
other-than-temporary impairments:
• $169 million in the fixed maturities portfolio, consisting of $81 million related to structured
mortgage securities, $70 million related to the deteriorated financial position of various issuers
and $18 million related to securities the Company either had the intent to sell or did not have
the ability to assert an intention to hold until recovery in market value;
• $79 million in the equity portfolio related to securities with respect to which it was determined
that the cost basis of those securities would not be recovered over the expected holding period.
The majority of these impairments were related to issuers in the financial industry; and
• $10 million in other investments related to the decline in the financial condition of various
issuers.
For the year ended December 31, 2008, the Company recognized the following
other-than-temporary impairments:
• $324 million in the fixed maturities portfolio, consisting of $210 million related to the
deteriorated financial position of various issuers (of which $70 million related to securities issued
by Lehman Brothers Holdings, Inc. and its subsidiaries), $81 million related to externally
managed securities with respect to which the Company does not have the ability to assert an
intention to hold until recovery in market value and $33 million resulting from the intent or
potential to sell various holdings prior to a recovery in market value;
• $74 million in the equity portfolio consisting of $26 million related to externally managed
securities with respect to which the Company does not have the ability to assert an intention to
hold until recovery in fair value, $26 million related to securities with respect to which it was
determined that the cost basis of those securities would not be recovered over the expected
holding period and $22 million resulting from the intent or potential to sell prior to a recovery
in fair value;
109