Travelers 2009 Annual Report Download - page 87
Download and view the complete annual report
Please find page 87 of the 2009 Travelers annual report below. You can navigate through the pages in the report by either clicking on the pages listed below, or by using the keyword search tool below to find specific information within the annual report.-
 1
1 -
2
-
3
-
4
-
5
-
6
-
7
-
8
-
9
-
10
-
11
-
12
-
13
-
14
-
15
-
16
-
17
-
18
-
19
-
20
-
21
-
22
-
23
-
24
-
25
-
26
-
27
-
28
-
29
-
30
-
31
-
32
-
33
-
34
-
35
-
36
-
37
-
38
-
39
-
40
-
41
-
42
-
43
-
44
-
45
-
46
-
47
-
48
-
49
-
50
-
51
-
52
-
53
-
54
-
55
-
56
-
57
-
58
-
59
-
60
-
61
-
62
-
63
-
64
-
65
-
66
-
67
-
68
-
69
-
70
-
71
-
72
-
73
-
74
-
75
-
76
-
 77
77 -
 78
78 -
 79
79 -
 80
80 -
 81
81 -
 82
82 -
 83
83 -
 84
84 -
 85
85 -
 86
86 -
 87
87 -
 88
88 -
 89
89 -
 90
90 -
 91
91 -
 92
92 -
 93
93 -
 94
94 -
 95
95 -
 96
96 -
 97
97 -
98
-
99
-
100
-
101
-
102
-
103
-
104
-
105
-
106
-
107
-
108
-
109
-
110
-
111
-
112
-
113
-
114
-
115
-
116
-
117
-
118
-
119
-
120
-
121
-
122
-
123
-
124
-
125
-
126
-
127
-
128
-
129
-
130
-
131
-
132
-
133
-
134
-
135
-
136
-
137
-
138
-
139
-
140
-
141
-
142
-
143
-
144
-
145
-
146
-
147
-
148
-
149
-
150
-
151
-
152
-
153
-
154
-
155
-
156
-
157
-
158
-
159
-
160
-
161
-
162
-
163
-
164
-
165
-
166
-
167
-
168
-
169
-
170
-
171
-
172
-
173
-
174
-
175
-
176
-
177
-
178
-
179
-
180
-
181
-
182
-
183
-
184
-
185
-
186
-
187
-
188
-
189
-
190
-
191
-
192
-
193
-
194
-
195
-
196
-
197
-
198
-
199
-
200
-
201
-
202
-
203
-
204
-
205
-
206
-
207
-
208
-
209
-
210
-
211
-
212
-
213
-
214
-
215
-
216
-
217
-
218
-
219
-
220
-
221
-
222
-
223
-
224
-
225
-
226
-
227
-
228
-
229
-
230
-
231
-
232
-
233
-
234
-
235
-
236
-
237
-
238
-
239
-
240
-
241
-
242
-
243
-
244
-
245
-
246
-
247
-
248
-
249
-
250
-
251
-
252
-
253
-
254
-
255
-
256
-
257
-
258
-
259
-
260
-
261
-
262
-
263
-
264
-
265
-
266
-
267
-
268
-
269
-
270
-
271
-
272
-
273
-
274
-
275
-
276
-
277
-
278
-
279
-
280
-
281
-
282
-
283
-
284
-
285
-
286
-
287
-
288
-
289
-
290
-
291
-
292
-
293
-
294
-
295
 |
 |

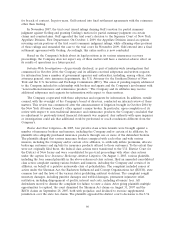
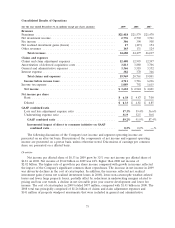
to its sale. In April 2007, the Company sold Mendota Insurance Company and its subsidiaries
(collectively, Mendota), which primarily offered nonstandard automobile coverage and accounted for
$46 million of earned premiums in 2007 prior to its sale. Adjusting for these sales in 2007, consolidated
earned premiums in 2008 increased by $182 million, or 1%, over 2007. In the Business Insurance
segment, earned premiums in 2008 declined 1% from 2007 despite continued strong business retention
rates, reflecting the impact of competitive market conditions on pricing and new business. In the
Financial, Professional & International Insurance segment, earned premium growth of 2% in 2008
(adjusted for the sale of Afianzadora Insurgentes) was driven by changes in the terms of certain
reinsurance treaties for Bond & Financial Products. In the Personal Insurance segment, earned
premium growth of 3% in 2008 (adjusted for the sale of Mendota) reflected continued strong business
retention rates and new business volume, coupled with continued renewal price increases.
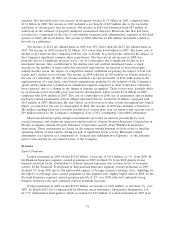
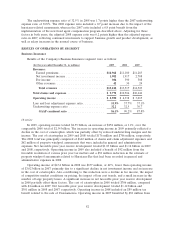
Net Investment Income
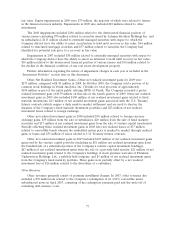
The following table sets forth information regarding the Company’s investments.
(for the year ended December 31, in millions) 2009 2008 2007
Average investments(a)..................................... $73,130 $74,197 $73,872
Pretax net investment income ................................ 2,776 2,792 3,761
After-tax net investment income . . . . . . . . . . . . . . . . . . . . . . . . . . . . . . 2,290 2,299 2,915
Average pretax yield(b) .................................... 3.8% 3.8% 5.1%
Average after-tax yield(b)................................... 3.1% 3.1% 3.9%
(a) Excludes net unrealized investment gains and losses, net of tax, and reflects cash, receivables for
investment sales, payables on investment purchases and accrued investment income.
(b) Excludes net realized investment gains and losses and net unrealized investment gains and losses.
Net investment income of $2.78 billion in 2009 was $16 million, or less than 1%, lower than in
2008, primarily resulting from a significant decline in short-term interest rates, a lower average level of
long-term fixed maturity invested assets and the unfavorable impact of foreign currency exchange rates.
Those factors were largely offset by improved returns from non-fixed maturity investments, which
generated negative net investment income of $40 million in 2009, compared with negative net
investment income of $222 million in 2008. The average pretax yield on the total investment portfolio
was 3.8% in both 2009 and 2008. The improved performance from non-fixed income investments in
2009 reflected improving capital market conditions in the second half of the year. The amortized cost
of the fixed maturity and short-term security portion of the investment portfolio at December 31, 2009
totaled $68.16 billion, $1.37 billion higher than at the same date in 2008, primarily reflecting the impact
of strong operating cash flows during 2009 (a portion of which was invested in fixed maturity securities)
and the issuance of $500 million of senior notes in the second quarter of 2009. These factors were
partially offset by $3.30 billion of common share repurchases during 2009, $693 million of dividends
paid to shareholders and contributions of $260 million to the Company’s pension plan in 2009.
Net investment income of $2.79 billion in 2008 declined $969 million, or 26%, from 2007, primarily
due to lower returns from non-fixed maturity investments, which produced negative net investment
income of $222 million in 2008, compared with positive net investment income of $648 million in 2007.
The decline in net investment income from these investments in 2008 reflected market conditions,
which resulted in a lower level of transactions, including sales and initial public offerings, and lower
market values compared to those at December 31, 2007. The average pretax yield on the total
investment portfolio of 3.8% in 2008 declined from 5.1% in 2007, primarily reflecting the negative
investment income from non-fixed maturity investments in 2008. Net investment income from the
Company’s fixed maturity portfolio in 2008 also declined from 2007, primarily due to a significant
decline in short-term interest rates. The amortized cost of the fixed maturity and short-term security
75