Travelers 2009 Annual Report Download - page 249
Download and view the complete annual report
Please find page 249 of the 2009 Travelers annual report below. You can navigate through the pages in the report by either clicking on the pages listed below, or by using the keyword search tool below to find specific information within the annual report.-
 1
1 -
2
-
3
-
4
-
5
-
6
-
7
-
8
-
9
-
10
-
11
-
12
-
13
-
14
-
15
-
16
-
17
-
18
-
19
-
20
-
21
-
22
-
23
-
24
-
25
-
26
-
27
-
28
-
29
-
30
-
31
-
32
-
33
-
34
-
35
-
36
-
37
-
38
-
39
-
40
-
41
-
42
-
43
-
44
-
45
-
46
-
47
-
48
-
49
-
50
-
51
-
52
-
53
-
54
-
55
-
56
-
57
-
58
-
59
-
60
-
61
-
62
-
63
-
64
-
65
-
66
-
67
-
68
-
69
-
70
-
71
-
72
-
73
-
74
-
75
-
76
-
77
-
78
-
79
-
80
-
81
-
82
-
83
-
84
-
85
-
86
-
87
-
88
-
89
-
90
-
91
-
92
-
93
-
94
-
95
-
96
-
97
-
98
-
99
-
100
-
101
-
102
-
103
-
104
-
105
-
106
-
107
-
108
-
109
-
110
-
111
-
112
-
113
-
114
-
115
-
116
-
117
-
118
-
119
-
120
-
121
-
122
-
123
-
124
-
125
-
126
-
127
-
128
-
129
-
130
-
131
-
132
-
133
-
134
-
135
-
136
-
137
-
138
-
139
-
140
-
141
-
142
-
143
-
144
-
145
-
146
-
147
-
148
-
149
-
150
-
151
-
152
-
153
-
154
-
155
-
156
-
157
-
158
-
159
-
160
-
161
-
162
-
163
-
164
-
165
-
166
-
167
-
168
-
169
-
170
-
171
-
172
-
173
-
174
-
175
-
176
-
177
-
178
-
179
-
180
-
181
-
182
-
183
-
184
-
185
-
186
-
187
-
188
-
189
-
190
-
191
-
192
-
193
-
194
-
195
-
196
-
197
-
198
-
199
-
200
-
201
-
202
-
203
-
204
-
205
-
206
-
207
-
208
-
209
-
210
-
211
-
212
-
213
-
214
-
215
-
216
-
217
-
218
-
219
-
220
-
221
-
222
-
223
-
224
-
225
-
226
-
227
-
228
-
229
-
230
-
231
-
232
-
233
-
234
-
235
-
236
-
237
-
238
-
 239
239 -
 240
240 -
 241
241 -
 242
242 -
 243
243 -
 244
244 -
 245
245 -
 246
246 -
 247
247 -
 248
248 -
 249
249 -
 250
250 -
 251
251 -
 252
252 -
 253
253 -
 254
254 -
 255
255 -
 256
256 -
 257
257 -
 258
258 -
 259
259 -
260
-
261
-
262
-
263
-
264
-
265
-
266
-
267
-
268
-
269
-
270
-
271
-
272
-
273
-
274
-
275
-
276
-
277
-
278
-
279
-
280
-
281
-
282
-
283
-
284
-
285
-
286
-
287
-
288
-
289
-
290
-
291
-
292
-
293
-
294
-
295
 |
 |

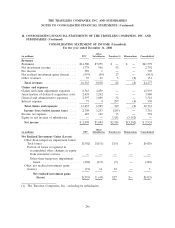
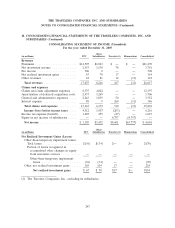
THE TRAVELERS COMPANIES, INC. AND SUBSIDIARIES
NOTES TO CONSOLIDATED FINANCIAL STATEMENTS (Continued)
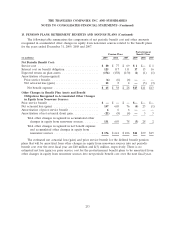
13. PENSION PLANS, RETIREMENT BENEFITS AND SAVINGS PLANS (Continued)
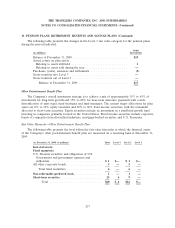
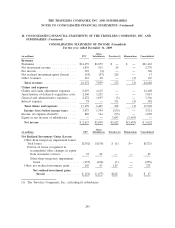
The following table presents the changes in the Level 3 fair value category for the pension plans
during the period indicated.
Other
(in millions) Investments
Balance at December 31, 2008 ............................... $19
Actual return on plan assets:
Relating to assets still held ................................ 1
Relating to assets sold during the year . . . . . . . . . . . . . . . . . . . . . . . . —
Purchases, (sales), issuances and settlements . . . . . . . . . . . . . . . . . . . . . (3)
Gross transfers into Level 3 ................................. —
Gross transfers out of Level 3 . . . . . . . . . . . . . . . . . . . . . . . . . . . . . . . . —
Balance at December 31, 2009 . . . . . . . . . . . . . . . . . . . . . . . . . . . . $17
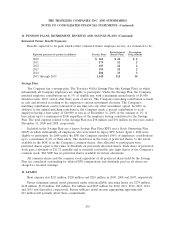
Other Postretirement Benefit Plan
The Company’s overall investment strategy is to achieve a mix of approximately 35% to 65% of
investments for long-term growth and 35% to 60% for near-term insurance payments with a wide
diversification of asset types, fund strategies and fund managers. The current target allocations for plan
assets are 0% to 10% equity securities and 20% to 60% fixed income securities, with the remainder
allocated to short-term securities. Equity securities include an investment in a small-mid growth fund
investing in companies primarily located in the United States. Fixed income securities include corporate
bonds of companies from diversified industries, mortgage-backed securities and U.S. Treasuries.
Fair Value Hierarchy—Other Postretirement Benefit Plan
The following table presents the level within the fair value hierarchy at which the financial assets
of the Company’s other postretirement benefit plan are measured on a recurring basis at December 31,
2009.
(at December 31, 2009, in millions) Total Level 1 Level 2 Level 3
Invested assets:
Fixed maturities
U.S. Treasury securities and obligations of U.S.
Government and government agencies and
authorities.............................. $ 1 $— $ 1 $—
All other corporate bonds . . . . . . . . . . . . . . . . . . . . 5— 5 —
Total fixed maturities . . . . . . . . . . . . . . . . . . . . 6— 6 —
Non-redeemable preferred stock ................ 1— 1 —
Short-term securities ........................ 13 4 9 —
Total .............................. $20 $ 4 $16 $—
237