Travelers 2009 Annual Report Download - page 122
Download and view the complete annual report
Please find page 122 of the 2009 Travelers annual report below. You can navigate through the pages in the report by either clicking on the pages listed below, or by using the keyword search tool below to find specific information within the annual report.-
 1
1 -
2
-
3
-
4
-
5
-
6
-
7
-
8
-
9
-
10
-
11
-
12
-
13
-
14
-
15
-
16
-
17
-
18
-
19
-
20
-
21
-
22
-
23
-
24
-
25
-
26
-
27
-
28
-
29
-
30
-
31
-
32
-
33
-
34
-
35
-
36
-
37
-
38
-
39
-
40
-
41
-
42
-
43
-
44
-
45
-
46
-
47
-
48
-
49
-
50
-
51
-
52
-
53
-
54
-
55
-
56
-
57
-
58
-
59
-
60
-
61
-
62
-
63
-
64
-
65
-
66
-
67
-
68
-
69
-
70
-
71
-
72
-
73
-
74
-
75
-
76
-
77
-
78
-
79
-
80
-
81
-
82
-
83
-
84
-
85
-
86
-
87
-
88
-
89
-
90
-
91
-
92
-
93
-
94
-
95
-
96
-
97
-
98
-
99
-
100
-
101
-
102
-
103
-
104
-
105
-
106
-
107
-
108
-
109
-
110
-
111
-
 112
112 -
 113
113 -
 114
114 -
 115
115 -
 116
116 -
 117
117 -
 118
118 -
 119
119 -
 120
120 -
 121
121 -
 122
122 -
 123
123 -
 124
124 -
 125
125 -
 126
126 -
 127
127 -
 128
128 -
 129
129 -
 130
130 -
 131
131 -
 132
132 -
133
-
134
-
135
-
136
-
137
-
138
-
139
-
140
-
141
-
142
-
143
-
144
-
145
-
146
-
147
-
148
-
149
-
150
-
151
-
152
-
153
-
154
-
155
-
156
-
157
-
158
-
159
-
160
-
161
-
162
-
163
-
164
-
165
-
166
-
167
-
168
-
169
-
170
-
171
-
172
-
173
-
174
-
175
-
176
-
177
-
178
-
179
-
180
-
181
-
182
-
183
-
184
-
185
-
186
-
187
-
188
-
189
-
190
-
191
-
192
-
193
-
194
-
195
-
196
-
197
-
198
-
199
-
200
-
201
-
202
-
203
-
204
-
205
-
206
-
207
-
208
-
209
-
210
-
211
-
212
-
213
-
214
-
215
-
216
-
217
-
218
-
219
-
220
-
221
-
222
-
223
-
224
-
225
-
226
-
227
-
228
-
229
-
230
-
231
-
232
-
233
-
234
-
235
-
236
-
237
-
238
-
239
-
240
-
241
-
242
-
243
-
244
-
245
-
246
-
247
-
248
-
249
-
250
-
251
-
252
-
253
-
254
-
255
-
256
-
257
-
258
-
259
-
260
-
261
-
262
-
263
-
264
-
265
-
266
-
267
-
268
-
269
-
270
-
271
-
272
-
273
-
274
-
275
-
276
-
277
-
278
-
279
-
280
-
281
-
282
-
283
-
284
-
285
-
286
-
287
-
288
-
289
-
290
-
291
-
292
-
293
-
294
-
295
 |
 |

• $14 million in the venture capital portfolio on 16 holdings, consisting of $6 million related to six
holdings which were externally managed securities with respect to which the Company does not
have the ability to assert an intention to hold until recovery in fair value and ten holdings which
experienced fundamental economic deterioration; and
• $8 million in other investments of which $6 million related to the decline in the financial
condition of a privately-held investment and $2 million resulted from the intent or potential to
sell prior to a recovery in fair value.
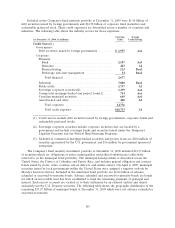
For the year ended December 31, 2007, the Company recognized the following
other-than-temporary impairments:
• $37 million in the fixed maturities portfolio, consisting of $23 million related to externally
managed securities with respect to which the Company does not have the ability to assert an
intention to hold until recovery in fair value, and $14 million related to credit risk associated
with various issuers’ deteriorated financial position;
• $7 million in the equity portfolio related to externally managed securities with respect to which
the Company does not have the ability to assert an intention to hold until recovery in fair value;
• $10 million in the real estate portfolio, related to the decline in the financial condition of one
real estate development property; and
• $16 million in the venture capital portfolio on 14 holdings. Three of the holdings were public
securities whose cost basis was not anticipated to be recovered over the expected holding period.
Nine holdings experienced economic deterioration (characterized by less than expected revenues
or a change in product). The remaining two holdings were impaired due to the impending sale,
liquidation or shutdown of the entity.
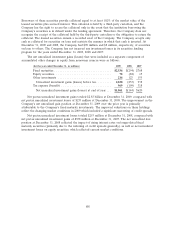
The Company had a net pretax unrealized gain of $2.54 billion in its fixed maturities portfolio at
December 31, 2009, compared with a net pretax unrealized loss of $294 million at December 31, 2008.
In 2009, yields on municipal fixed maturity securities declined, which increased the market value of the
Company’s portfolio of such securities. In addition, credit spreads narrowed on other non-municipal
fixed maturity securities which also resulted in an increase in the market value of those securities.
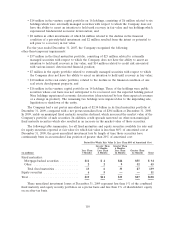
The following table summarizes, for all fixed maturities and equity securities available for sale and
for equity securities reported at fair value for which fair value is less than 80% of amortized cost at
December 31, 2009, the gross unrealized investment loss by length of time those securities have
continuously been in an unrealized loss position of greater than 20% of amortized cost:
Period For Which Fair Value Is Less Than 80% of Amortized Cost
Greater Than Greater Than
3 Months, 6 Months,
Less Than Less Than Less Than Greater Than
(in millions) 3 Months 6 Months 12 Months 12 Months Total
Fixed maturities:
Mortgage-backed securities . . . . . . . . . . . $11 $ 4 $24 $55 $ 94
Other .......................... 22 93245
Total fixed maturities . . . . . . . . . . . . . . 13 6 33 87 139
Equity securities .................... 65——11
Total............................. $19 $11 $33 $87 $150
These unrealized investment losses at December 31, 2009 represent less than 1% of the combined
fixed maturity and equity security portfolios on a pretax basis and less than 1% of shareholders’ equity
on an after-tax basis.
110