Travelers 2009 Annual Report Download - page 102
Download and view the complete annual report
Please find page 102 of the 2009 Travelers annual report below. You can navigate through the pages in the report by either clicking on the pages listed below, or by using the keyword search tool below to find specific information within the annual report.-
 1
1 -
2
-
3
-
4
-
5
-
6
-
7
-
8
-
9
-
10
-
11
-
12
-
13
-
14
-
15
-
16
-
17
-
18
-
19
-
20
-
21
-
22
-
23
-
24
-
25
-
26
-
27
-
28
-
29
-
30
-
31
-
32
-
33
-
34
-
35
-
36
-
37
-
38
-
39
-
40
-
41
-
42
-
43
-
44
-
45
-
46
-
47
-
48
-
49
-
50
-
51
-
52
-
53
-
54
-
55
-
56
-
57
-
58
-
59
-
60
-
61
-
62
-
63
-
64
-
65
-
66
-
67
-
68
-
69
-
70
-
71
-
72
-
73
-
74
-
75
-
76
-
77
-
78
-
79
-
80
-
81
-
82
-
83
-
84
-
85
-
86
-
87
-
88
-
89
-
90
-
91
-
 92
92 -
 93
93 -
 94
94 -
 95
95 -
 96
96 -
 97
97 -
 98
98 -
 99
99 -
 100
100 -
 101
101 -
 102
102 -
 103
103 -
 104
104 -
 105
105 -
 106
106 -
 107
107 -
 108
108 -
 109
109 -
 110
110 -
 111
111 -
 112
112 -
113
-
114
-
115
-
116
-
117
-
118
-
119
-
120
-
121
-
122
-
123
-
124
-
125
-
126
-
127
-
128
-
129
-
130
-
131
-
132
-
133
-
134
-
135
-
136
-
137
-
138
-
139
-
140
-
141
-
142
-
143
-
144
-
145
-
146
-
147
-
148
-
149
-
150
-
151
-
152
-
153
-
154
-
155
-
156
-
157
-
158
-
159
-
160
-
161
-
162
-
163
-
164
-
165
-
166
-
167
-
168
-
169
-
170
-
171
-
172
-
173
-
174
-
175
-
176
-
177
-
178
-
179
-
180
-
181
-
182
-
183
-
184
-
185
-
186
-
187
-
188
-
189
-
190
-
191
-
192
-
193
-
194
-
195
-
196
-
197
-
198
-
199
-
200
-
201
-
202
-
203
-
204
-
205
-
206
-
207
-
208
-
209
-
210
-
211
-
212
-
213
-
214
-
215
-
216
-
217
-
218
-
219
-
220
-
221
-
222
-
223
-
224
-
225
-
226
-
227
-
228
-
229
-
230
-
231
-
232
-
233
-
234
-
235
-
236
-
237
-
238
-
239
-
240
-
241
-
242
-
243
-
244
-
245
-
246
-
247
-
248
-
249
-
250
-
251
-
252
-
253
-
254
-
255
-
256
-
257
-
258
-
259
-
260
-
261
-
262
-
263
-
264
-
265
-
266
-
267
-
268
-
269
-
270
-
271
-
272
-
273
-
274
-
275
-
276
-
277
-
278
-
279
-
280
-
281
-
282
-
283
-
284
-
285
-
286
-
287
-
288
-
289
-
290
-
291
-
292
-
293
-
294
-
295
 |
 |
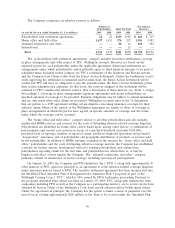
adjustment expenses in 2008 totaled $73 million, compared with no catastrophe losses in 2007.
Hurricanes Ike and Gustav accounted for the majority of catastrophe losses in 2008.
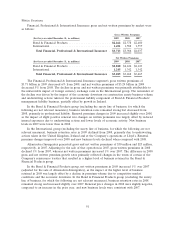
Net favorable prior year reserve development totaled $274 million in 2008, primarily driven by
better than expected loss experience in the International group. The improvements in longer-tail lines
of business were attributable to several factors, including enhanced risk control and underwriting
strategies throughout the International group. In the property line of business, the improvement
primarily resulted from better than anticipated loss development in the United Kingdom, in part due to
favorable claim activity relating to 2007 flood losses. In the Bond & Financial Products group, better
than expected loss experience for the contract surety business within the fidelity and surety product
line, resulting from favorable settlements on large claims (primarily from accident years prior to 2005),
resulted in net favorable prior year reserve development in 2008. In 2007, net favorable prior year
reserve development totaled $93 million, primarily reflecting better than expected loss development in
international property, employers’ liability, professional indemnity and motor lines of business for
recent accident years, which was attributable to several factors, including enhanced pricing and
underwriting strategies throughout the International operations, and the favorable impact of legal and
judicial reforms in Ireland.
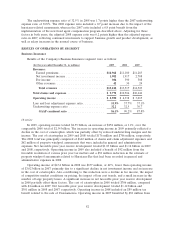
The amortization of deferred acquisition costs totaled $622 million in 2009, $30 million, or 5%,
lower than the comparable 2008 total of $652 million. The declines were driven by the favorable impact
of foreign currency exchange rates and changes in the mix of business.
General and administrative expenses in 2009 totaled $579 million, slightly lower than $581 million
in 2008. The decline in 2009 primarily reflected the favorable impact of foreign currency exchange
rates, which was largely offset by an increase in employee-related expenses associated with growth
initiatives. General and administrative expenses in 2008 were $9 million lower than in 2007, primarily
reflecting a decrease in commission expense.
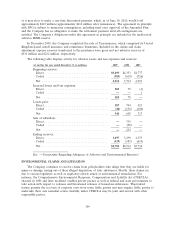
GAAP Combined Ratio
In 2009, the loss and loss adjustment expense ratio of 52.1% was 0.9 points higher than the ratio
of 51.2% in 2008. The 2009 ratio included a 5.1 point benefit from net favorable prior year reserve
development and a 0.1 point impact from the cost of catastrophes, whereas the 2008 ratio included an
8.0 point benefit from net favorable prior year reserve development and a 2.3 point impact from the
cost of catastrophes. The loss and loss adjustment expense ratio in 2009 adjusted for the cost of
catastrophes and prior year reserve development was 0.2 points higher than the 2008 ratio on the same
basis, as the impact of loss cost trends was partially offset by the favorable impact of lower large losses
in the International group.
The underwriting expense ratio of 36.0% for 2009 was level with the underwriting expense ratio in
2008. The 2008 expense ratio included a 0.2 point impact from hurricane-related assessments. Adjusting
for that factor in 2008, the 2009 underwriting expense ratio was 0.2 points higher than the 2008 ratio.
The loss and loss adjustment expense ratio of 51.2% in 2008 was 0.4 points higher than the 2007
ratio of 50.8%. The 2008 ratio included an 8.0 point benefit from net favorable prior year reserve
development and a 2.3 point impact from the cost of catastrophes, whereas the 2007 ratio included a
2.7 point benefit from net favorable prior year reserve development and no impact from catastrophe
losses. The 2008 loss and loss adjustment expense ratio adjusted for catastrophe losses and prior year
reserve development was 3.4 points higher than the 2007 ratio on the same basis, primarily reflecting
an increase in the number of large losses that exceeded expectations within International. The
underwriting expense ratio of 36.0% in 2008 was 0.8 points lower than in 2007. The 2008 expense ratio
included a 0.2 point impact of hurricane-related assessments. Adjusting for these assessments, the 2008
expense ratio was 1.0 points lower than the expense ratio in 2007, reflecting reduced acquisition costs.
90