Travelers 2008 Annual Report Download - page 98
Download and view the complete annual report
Please find page 98 of the 2008 Travelers annual report below. You can navigate through the pages in the report by either clicking on the pages listed below, or by using the keyword search tool below to find specific information within the annual report.-
 1
1 -
2
-
3
-
4
-
5
-
6
-
7
-
8
-
9
-
10
-
11
-
12
-
13
-
14
-
15
-
16
-
17
-
18
-
19
-
20
-
21
-
22
-
23
-
24
-
25
-
26
-
27
-
28
-
29
-
30
-
31
-
32
-
33
-
34
-
35
-
36
-
37
-
38
-
39
-
40
-
41
-
42
-
43
-
44
-
45
-
46
-
47
-
48
-
49
-
50
-
51
-
52
-
53
-
54
-
55
-
56
-
57
-
58
-
59
-
60
-
61
-
62
-
63
-
64
-
65
-
66
-
67
-
68
-
69
-
70
-
71
-
72
-
73
-
74
-
75
-
76
-
77
-
78
-
79
-
80
-
81
-
82
-
83
-
84
-
85
-
86
-
87
-
 88
88 -
 89
89 -
 90
90 -
 91
91 -
 92
92 -
 93
93 -
 94
94 -
 95
95 -
 96
96 -
 97
97 -
 98
98 -
 99
99 -
 100
100 -
 101
101 -
 102
102 -
 103
103 -
 104
104 -
 105
105 -
 106
106 -
 107
107 -
 108
108 -
109
-
110
-
111
-
112
-
113
-
114
-
115
-
116
-
117
-
118
-
119
-
120
-
121
-
122
-
123
-
124
-
125
-
126
-
127
-
128
-
129
-
130
-
131
-
132
-
133
-
134
-
135
-
136
-
137
-
138
-
139
-
140
-
141
-
142
-
143
-
144
-
145
-
146
-
147
-
148
-
149
-
150
-
151
-
152
-
153
-
154
-
155
-
156
-
157
-
158
-
159
-
160
-
161
-
162
-
163
-
164
-
165
-
166
-
167
-
168
-
169
-
170
-
171
-
172
-
173
-
174
-
175
-
176
-
177
-
178
-
179
-
180
-
181
-
182
-
183
-
184
-
185
-
186
-
187
-
188
-
189
-
190
-
191
-
192
-
193
-
194
-
195
-
196
-
197
-
198
-
199
-
200
-
201
-
202
-
203
-
204
-
205
-
206
-
207
-
208
-
209
-
210
-
211
-
212
-
213
-
214
-
215
-
216
-
217
-
218
-
219
-
220
-
221
-
222
-
223
-
224
-
225
-
226
-
227
-
228
-
229
-
230
-
231
-
232
-
233
-
234
-
235
-
236
-
237
-
238
-
239
-
240
-
241
-
242
-
243
-
244
-
245
-
246
-
247
-
248
-
249
-
250
-
251
-
252
-
253
-
254
-
255
-
256
-
257
-
258
-
259
-
260
-
261
-
262
-
263
-
264
-
265
-
266
-
267
-
268
-
269
-
270
-
271
-
272
-
273
-
274
-
275
-
276
-
277
-
278
-
279
-
280
-
281
-
282
-
283
-
284
-
285
-
286
-
287
-
288
 |
 |

agent compensation program in the first quarter of 2007 did not have a material impact on the
Financial, Professional & International Insurance segment. General and administrative expenses totaled
$590 million in 2007, an increase of 10% over the 2006 total of $536 million. The increase primarily
reflected the segment’s continued expenditures to support business growth and the impact of foreign
currency exchange rates.
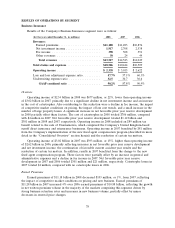
GAAP Combined Ratio
The loss and loss adjustment expense ratio of 51.2% in 2008 was 0.4 points higher than the 2007
ratio of 50.8%. The 2008 ratio included an 8.0 point benefit from net favorable prior year reserve
development and a 2.3 point impact from the cost of catastrophes, whereas the 2007 ratio included a
2.7 point benefit from net favorable prior year reserve development and no impact from catastrophe
losses. The 2008 loss and loss adjustment expense ratio adjusted for catastrophe losses and prior year
reserve development was 3.4 points higher than the 2007 ratio on the same basis, primarily reflecting
an increase in the number of large losses that exceeded expectations within International. The
underwriting expense ratio of 36.0% in 2008 was 0.8 points lower than in 2007. The 2008 expense ratio
included a 0.2 point impact of hurricane-related assessments. Adjusting for these assessments, the 2008
expense ratio was 1.0 points lower than the expense ratio in 2007, reflecting reduced acquisition costs.
The loss and loss adjustment expense ratio of 50.8% in 2007 was 2.9 points lower than the 2006
ratio of 53.7%. The 2007 ratio included a 2.7 point benefit from net favorable prior year reserve
development, compared with a 0.4 point benefit in 2006. Excluding this factor in each year, the 2007
ratio was 0.6 points lower than the 2006 ratio. The underwriting expense ratio of 36.8% in 2007 was 1.5
points higher than the comparable 2006 expense ratio, driven by the increase in expenses supporting
business growth.
Written Premiums
Financial, Professional & International Insurance gross and net written premiums by market were
as follows:
Gross Written Premiums
(for the year ended December 31, in millions) 2008 2007 2006
Bond & Financial Products ....................... $2,507 $2,614 $2,657
International ................................. 1,459 1,423 1,324
Total Financial, Professional & International
Insurance ................................ $3,966 $4,037 $3,981
Net Written Premiums
(for the year ended December 31, in millions) 2008 2007 2006
Bond & Financial Products ....................... $2,228 $2,228 $2,255
International ................................. 1,240 1,237 1,138
Total Financial, Professional & International
Insurance ................................ $3,468 $3,465 $3,393
Afianzadora Insurgentes generated gross and net written premiums of $30 million and $25 million,
respectively, in 2007. Adjusting for the sale of that operation in 2007, gross written premiums in 2008
declined 1% from 2007, whereas net written premiums increased 1% over 2007. The difference in 2008
gross and net written premium growth rates primarily reflected changes in the terms of certain of the
Company’s reinsurance treaties that resulted in a higher level of business retained in the Bond &
Financial Products group.
86