Travelers 2008 Annual Report Download - page 102
Download and view the complete annual report
Please find page 102 of the 2008 Travelers annual report below. You can navigate through the pages in the report by either clicking on the pages listed below, or by using the keyword search tool below to find specific information within the annual report.-
 1
1 -
2
-
3
-
4
-
5
-
6
-
7
-
8
-
9
-
10
-
11
-
12
-
13
-
14
-
15
-
16
-
17
-
18
-
19
-
20
-
21
-
22
-
23
-
24
-
25
-
26
-
27
-
28
-
29
-
30
-
31
-
32
-
33
-
34
-
35
-
36
-
37
-
38
-
39
-
40
-
41
-
42
-
43
-
44
-
45
-
46
-
47
-
48
-
49
-
50
-
51
-
52
-
53
-
54
-
55
-
56
-
57
-
58
-
59
-
60
-
61
-
62
-
63
-
64
-
65
-
66
-
67
-
68
-
69
-
70
-
71
-
72
-
73
-
74
-
75
-
76
-
77
-
78
-
79
-
80
-
81
-
82
-
83
-
84
-
85
-
86
-
87
-
88
-
89
-
90
-
91
-
 92
92 -
 93
93 -
 94
94 -
 95
95 -
 96
96 -
 97
97 -
 98
98 -
 99
99 -
 100
100 -
 101
101 -
 102
102 -
 103
103 -
 104
104 -
 105
105 -
 106
106 -
 107
107 -
 108
108 -
 109
109 -
 110
110 -
 111
111 -
 112
112 -
113
-
114
-
115
-
116
-
117
-
118
-
119
-
120
-
121
-
122
-
123
-
124
-
125
-
126
-
127
-
128
-
129
-
130
-
131
-
132
-
133
-
134
-
135
-
136
-
137
-
138
-
139
-
140
-
141
-
142
-
143
-
144
-
145
-
146
-
147
-
148
-
149
-
150
-
151
-
152
-
153
-
154
-
155
-
156
-
157
-
158
-
159
-
160
-
161
-
162
-
163
-
164
-
165
-
166
-
167
-
168
-
169
-
170
-
171
-
172
-
173
-
174
-
175
-
176
-
177
-
178
-
179
-
180
-
181
-
182
-
183
-
184
-
185
-
186
-
187
-
188
-
189
-
190
-
191
-
192
-
193
-
194
-
195
-
196
-
197
-
198
-
199
-
200
-
201
-
202
-
203
-
204
-
205
-
206
-
207
-
208
-
209
-
210
-
211
-
212
-
213
-
214
-
215
-
216
-
217
-
218
-
219
-
220
-
221
-
222
-
223
-
224
-
225
-
226
-
227
-
228
-
229
-
230
-
231
-
232
-
233
-
234
-
235
-
236
-
237
-
238
-
239
-
240
-
241
-
242
-
243
-
244
-
245
-
246
-
247
-
248
-
249
-
250
-
251
-
252
-
253
-
254
-
255
-
256
-
257
-
258
-
259
-
260
-
261
-
262
-
263
-
264
-
265
-
266
-
267
-
268
-
269
-
270
-
271
-
272
-
273
-
274
-
275
-
276
-
277
-
278
-
279
-
280
-
281
-
282
-
283
-
284
-
285
-
286
-
287
-
288
 |
 |

to increased business volume, and continued investments to support business growth and product
development. The implementation of the new fixed agent compensation program in 2007 resulted in a
$165 million reduction in reported general and administrative expenses, compared to what would have
been reported under the prior contingent commission program.
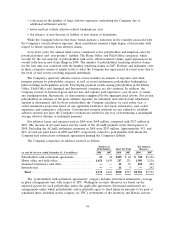
GAAP Combined Ratio
The loss and loss adjustment expense ratio of 66.2% in 2008 was 7.6 points higher than the
comparable 2007 ratio of 58.6%. The 2008 ratio included a 7.8 point impact of the cost of catastrophes
and a 2.1 point benefit from net favorable prior year reserve development, whereas the 2007 ratio
included a 2.4 point impact of the cost of catastrophes and a 2.2 point benefit from net favorable prior
year reserve development. The 2008 loss and loss adjustment expense ratio adjusted for catastrophe
losses and prior year reserve development was 2.1 points higher than the 2007 ratio on the same basis,
primarily reflecting the impact of an increase in non-catastrophe weather related losses in the
Homeowners and Other line of business and loss cost trends.
The loss and loss adjustment expense ratio of 58.6% in 2007 was 3.8 points higher than the
comparable 2006 ratio of 54.8%, primarily reflecting the decline in net favorable prior year reserve
development. The ratio in 2007 included a 2.2 point benefit from net favorable prior year reserve
development, compared with a 5.5 point benefit in 2006. Catastrophe losses accounted for 2.4 points
and 1.6 points, respectively, of the loss and loss adjustment expense ratios in 2007 and 2006. Excluding
the impact of prior year development and catastrophes in both years, the adjusted 2007 loss and loss
adjustment expense ratio was 0.3 points lower than the adjusted 2006 ratio.
The underwriting expense ratio of 30.8% in 2008 was 2.6 points higher than the 2007 ratio of
28.2%. The 2008 ratio included a 1.1 point impact from hurricane-related assessments, whereas the
2007 ratio included a 1.0 point benefit from the implementation of the new fixed agent compensation
program described in the ‘‘Consolidated Overview’’ section herein. Adjusting for these factors, the 2008
expense ratio was 0.5 points higher than the adjusted expense ratio for 2007, primarily reflecting
continued investments to support business growth and product development.
The underwriting expense ratio in 2007, excluding the 1.0 point benefit from the implementation of
the new fixed agent compensation program, was 0.9 points higher than the 2006 expense ratio of
28.3%, reflecting the impact of continued investments to support business growth and product
development.
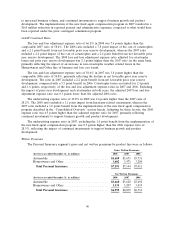
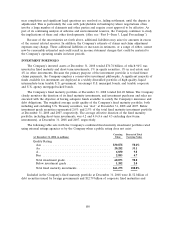
Written Premiums
The Personal Insurance segment’s gross and net written premiums by product line were as follows:
Gross Written Premiums
(for the year ended December 31, in millions) 2008 2007 2006
Automobile .................................. $3,689 $3,673 $3,731
Homeowners and Other ......................... 3,602 3,471 3,280
Total Personal Insurance ....................... $7,291 $7,144 $7,011
Net Written Premiums
(for the year ended December 31, in millions) 2008 2007 2006
Automobile .................................. $3,660 $3,628 $3,692
Homeowners and Other ......................... 3,335 3,207 3,019
Total Personal Insurance ....................... $6,995 $6,835 $6,711
90