Travelers 2008 Annual Report Download - page 208
Download and view the complete annual report
Please find page 208 of the 2008 Travelers annual report below. You can navigate through the pages in the report by either clicking on the pages listed below, or by using the keyword search tool below to find specific information within the annual report.-
 1
1 -
2
-
3
-
4
-
5
-
6
-
7
-
8
-
9
-
10
-
11
-
12
-
13
-
14
-
15
-
16
-
17
-
18
-
19
-
20
-
21
-
22
-
23
-
24
-
25
-
26
-
27
-
28
-
29
-
30
-
31
-
32
-
33
-
34
-
35
-
36
-
37
-
38
-
39
-
40
-
41
-
42
-
43
-
44
-
45
-
46
-
47
-
48
-
49
-
50
-
51
-
52
-
53
-
54
-
55
-
56
-
57
-
58
-
59
-
60
-
61
-
62
-
63
-
64
-
65
-
66
-
67
-
68
-
69
-
70
-
71
-
72
-
73
-
74
-
75
-
76
-
77
-
78
-
79
-
80
-
81
-
82
-
83
-
84
-
85
-
86
-
87
-
88
-
89
-
90
-
91
-
92
-
93
-
94
-
95
-
96
-
97
-
98
-
99
-
100
-
101
-
102
-
103
-
104
-
105
-
106
-
107
-
108
-
109
-
110
-
111
-
112
-
113
-
114
-
115
-
116
-
117
-
118
-
119
-
120
-
121
-
122
-
123
-
124
-
125
-
126
-
127
-
128
-
129
-
130
-
131
-
132
-
133
-
134
-
135
-
136
-
137
-
138
-
139
-
140
-
141
-
142
-
143
-
144
-
145
-
146
-
147
-
148
-
149
-
150
-
151
-
152
-
153
-
154
-
155
-
156
-
157
-
158
-
159
-
160
-
161
-
162
-
163
-
164
-
165
-
166
-
167
-
168
-
169
-
170
-
171
-
172
-
173
-
174
-
175
-
176
-
177
-
178
-
179
-
180
-
181
-
182
-
183
-
184
-
185
-
186
-
187
-
188
-
189
-
190
-
191
-
192
-
193
-
194
-
195
-
196
-
197
-
 198
198 -
 199
199 -
 200
200 -
 201
201 -
 202
202 -
 203
203 -
 204
204 -
 205
205 -
 206
206 -
 207
207 -
 208
208 -
 209
209 -
 210
210 -
 211
211 -
 212
212 -
 213
213 -
 214
214 -
 215
215 -
 216
216 -
 217
217 -
 218
218 -
219
-
220
-
221
-
222
-
223
-
224
-
225
-
226
-
227
-
228
-
229
-
230
-
231
-
232
-
233
-
234
-
235
-
236
-
237
-
238
-
239
-
240
-
241
-
242
-
243
-
244
-
245
-
246
-
247
-
248
-
249
-
250
-
251
-
252
-
253
-
254
-
255
-
256
-
257
-
258
-
259
-
260
-
261
-
262
-
263
-
264
-
265
-
266
-
267
-
268
-
269
-
270
-
271
-
272
-
273
-
274
-
275
-
276
-
277
-
278
-
279
-
280
-
281
-
282
-
283
-
284
-
285
-
286
-
287
-
288
 |
 |

THE TRAVELERS COMPANIES, INC. AND SUBSIDIARIES
NOTES TO CONSOLIDATED FINANCIAL STATEMENTS (Continued)
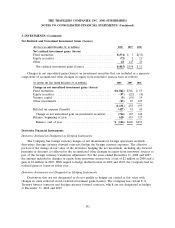
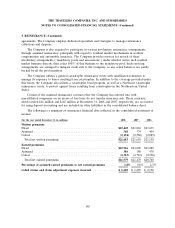
4. FAIR VALUE MEASUREMENTS (Continued)
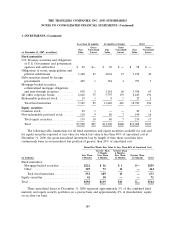
Fair Value Hierarchy
The following table presents the level within the fair value hierarchy at which the Company’s
financial assets and financial liabilities are measured on a recurring basis at December 31, 2008.
(in millions) Total Level 1 Level 2 Level 3
Invested assets:
Fixed maturities ..................... $61,275 $1,813 $59,308 $154
Equity securities ..................... 379 334 45 —
Other investments .................... 359 48 — 311
Total ............................ $62,013 $2,195 $59,353 $465
Other liabilities ........................ $ 2$2$—$—
The following table presents the changes in the Level 3 fair value category during the period
indicated.
Twelve Months Ended
(in millions) December 31, 2008
Balance at January 1, 2008 ................................... $511
Total realized and unrealized gains or (losses):
Included in realized investment gains and (losses) ................ 3
Included in increases or (decreases) in accumulated other changes in
equity from nonowner sources ............................. (52)
Purchases, (sales), issuances and settlements ...................... (11)
Transfers in and/or (out) of Level 3 ............................ 14
Balance at December 31, 2008 ............................. $465
Amount of total gains for the period included in earnings attributable to
changes in the fair value of assets still held at the reporting date ..... $10
The Company had no financial assets or financial liabilities that were measured at fair value on a
non-recurring basis during the twelve months ended December 31, 2008.
Valuation of Financial Instruments Disclosed at Fair Value
The Company uses various financial instruments in the normal course of its business. The
Company’s insurance contracts are excluded from FAS 107, Disclosures about Fair Value of Financial
Instruments and, therefore, are not included in the amounts discussed below.
The carrying values of cash, short-term securities, mortgage loans and investment income accrued
approximated their fair values. See notes 1 and 3.
The carrying values of $718 million and $885 million of financial instruments classified as other
assets approximated their fair values at December 31, 2008 and 2007, respectively. The carrying values
of $4.34 billion and $4.68 billion of financial instruments classified as other liabilities at December 31,
2008 and 2007, respectively, also approximated their fair values. Fair value is determined using various
methods including discounted cash flows, as appropriate for the various financial instruments.
196