Travelers 2008 Annual Report Download - page 213
Download and view the complete annual report
Please find page 213 of the 2008 Travelers annual report below. You can navigate through the pages in the report by either clicking on the pages listed below, or by using the keyword search tool below to find specific information within the annual report.-
 1
1 -
2
-
3
-
4
-
5
-
6
-
7
-
8
-
9
-
10
-
11
-
12
-
13
-
14
-
15
-
16
-
17
-
18
-
19
-
20
-
21
-
22
-
23
-
24
-
25
-
26
-
27
-
28
-
29
-
30
-
31
-
32
-
33
-
34
-
35
-
36
-
37
-
38
-
39
-
40
-
41
-
42
-
43
-
44
-
45
-
46
-
47
-
48
-
49
-
50
-
51
-
52
-
53
-
54
-
55
-
56
-
57
-
58
-
59
-
60
-
61
-
62
-
63
-
64
-
65
-
66
-
67
-
68
-
69
-
70
-
71
-
72
-
73
-
74
-
75
-
76
-
77
-
78
-
79
-
80
-
81
-
82
-
83
-
84
-
85
-
86
-
87
-
88
-
89
-
90
-
91
-
92
-
93
-
94
-
95
-
96
-
97
-
98
-
99
-
100
-
101
-
102
-
103
-
104
-
105
-
106
-
107
-
108
-
109
-
110
-
111
-
112
-
113
-
114
-
115
-
116
-
117
-
118
-
119
-
120
-
121
-
122
-
123
-
124
-
125
-
126
-
127
-
128
-
129
-
130
-
131
-
132
-
133
-
134
-
135
-
136
-
137
-
138
-
139
-
140
-
141
-
142
-
143
-
144
-
145
-
146
-
147
-
148
-
149
-
150
-
151
-
152
-
153
-
154
-
155
-
156
-
157
-
158
-
159
-
160
-
161
-
162
-
163
-
164
-
165
-
166
-
167
-
168
-
169
-
170
-
171
-
172
-
173
-
174
-
175
-
176
-
177
-
178
-
179
-
180
-
181
-
182
-
183
-
184
-
185
-
186
-
187
-
188
-
189
-
190
-
191
-
192
-
193
-
194
-
195
-
196
-
197
-
198
-
199
-
200
-
201
-
202
-
 203
203 -
 204
204 -
 205
205 -
 206
206 -
 207
207 -
 208
208 -
 209
209 -
 210
210 -
 211
211 -
 212
212 -
 213
213 -
 214
214 -
 215
215 -
 216
216 -
 217
217 -
 218
218 -
 219
219 -
 220
220 -
 221
221 -
 222
222 -
 223
223 -
224
-
225
-
226
-
227
-
228
-
229
-
230
-
231
-
232
-
233
-
234
-
235
-
236
-
237
-
238
-
239
-
240
-
241
-
242
-
243
-
244
-
245
-
246
-
247
-
248
-
249
-
250
-
251
-
252
-
253
-
254
-
255
-
256
-
257
-
258
-
259
-
260
-
261
-
262
-
263
-
264
-
265
-
266
-
267
-
268
-
269
-
270
-
271
-
272
-
273
-
274
-
275
-
276
-
277
-
278
-
279
-
280
-
281
-
282
-
283
-
284
-
285
-
286
-
287
-
288
 |
 |

THE TRAVELERS COMPANIES, INC. AND SUBSIDIARIES
NOTES TO CONSOLIDATED FINANCIAL STATEMENTS (Continued)
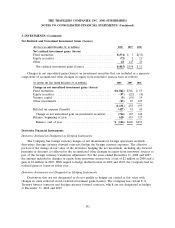
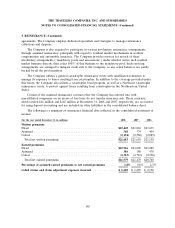
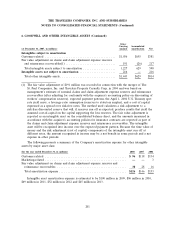
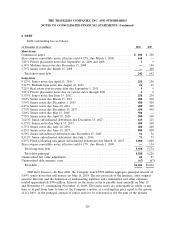
6. GOODWILL AND OTHER INTANGIBLE ASSETS (Continued)
Gross
Carrying Accumulated
(at December 31, 2007, in millions) Amount Amortization Net
Intangibles subject to amortization
Customer-related ......................................... $1,036 $655 $381
Fair value adjustment on claims and claim adjustment expense reserves
and reinsurance recoverables(1) ............................. 191 (26) 217
Total intangible assets subject to amortization ................... 1,227 629 598
Intangible assets not subject to amortization ..................... 216 — 216
Total other intangible assets ................................ $1,443 $629 $814
(1) The fair value adjustment of $191 million was recorded in connection with the merger of The
St. Paul Companies, Inc. and Travelers Property Casualty Corp. in 2004 and was based on
management’s estimate of nominal claims and claim adjustment expense reserves and reinsurance
recoverables (after adjusting for conformity with the acquirer’s accounting policy on discounting of
workers’ compensation reserves), expected payment patterns, the April 1, 2004 U.S. Treasury spot
rate yield curve, a leverage ratio assumption (reserves to statutory surplus), and a cost of capital
expressed as a spread over risk-free rates. The method used calculates a risk adjustment to a
risk-free discounted reserve that will, if reserves run off as expected, produce results that yield the
assumed cost-of-capital on the capital supporting the loss reserves. The fair value adjustment is
reported as an intangible asset on the consolidated balance sheet, and the amounts measured in
accordance with the acquirer’s accounting policies for insurance contracts are reported as part of
the claims and claim adjustment expense reserves and reinsurance recoverables. The intangible
asset will be recognized into income over the expected payment pattern. Because the time value of
money and the risk adjustment (cost of capital) components of the intangible asset run off at
different rates, the amount recognized in income may be a net benefit in some periods and a net
expense in other periods.
The following presents a summary of the Company’s amortization expense for other intangible
assets by major asset class:
(for the year ended December 31, in millions) 2008 2007 2006
Customer-related ............................................... $96 $118 $134
Marketing-related ............................................... ——3
Fair value adjustment on claims and claim adjustment expense reserves and
reinsurance recoverables ........................................ 30 28 16
Total amortization expense ....................................... $126 $146 $153
Intangible asset amortization expense is estimated to be $100 million in 2009, $86 million in 2010,
$69 million in 2011, $52 million in 2012 and $45 million in 2013.
201