Travelers 2008 Annual Report Download - page 96
Download and view the complete annual report
Please find page 96 of the 2008 Travelers annual report below. You can navigate through the pages in the report by either clicking on the pages listed below, or by using the keyword search tool below to find specific information within the annual report.-
 1
1 -
2
-
3
-
4
-
5
-
6
-
7
-
8
-
9
-
10
-
11
-
12
-
13
-
14
-
15
-
16
-
17
-
18
-
19
-
20
-
21
-
22
-
23
-
24
-
25
-
26
-
27
-
28
-
29
-
30
-
31
-
32
-
33
-
34
-
35
-
36
-
37
-
38
-
39
-
40
-
41
-
42
-
43
-
44
-
45
-
46
-
47
-
48
-
49
-
50
-
51
-
52
-
53
-
54
-
55
-
56
-
57
-
58
-
59
-
60
-
61
-
62
-
63
-
64
-
65
-
66
-
67
-
68
-
69
-
70
-
71
-
72
-
73
-
74
-
75
-
76
-
77
-
78
-
79
-
80
-
81
-
82
-
83
-
84
-
85
-
 86
86 -
 87
87 -
 88
88 -
 89
89 -
 90
90 -
 91
91 -
 92
92 -
 93
93 -
 94
94 -
 95
95 -
 96
96 -
 97
97 -
 98
98 -
 99
99 -
 100
100 -
 101
101 -
 102
102 -
 103
103 -
 104
104 -
 105
105 -
 106
106 -
107
-
108
-
109
-
110
-
111
-
112
-
113
-
114
-
115
-
116
-
117
-
118
-
119
-
120
-
121
-
122
-
123
-
124
-
125
-
126
-
127
-
128
-
129
-
130
-
131
-
132
-
133
-
134
-
135
-
136
-
137
-
138
-
139
-
140
-
141
-
142
-
143
-
144
-
145
-
146
-
147
-
148
-
149
-
150
-
151
-
152
-
153
-
154
-
155
-
156
-
157
-
158
-
159
-
160
-
161
-
162
-
163
-
164
-
165
-
166
-
167
-
168
-
169
-
170
-
171
-
172
-
173
-
174
-
175
-
176
-
177
-
178
-
179
-
180
-
181
-
182
-
183
-
184
-
185
-
186
-
187
-
188
-
189
-
190
-
191
-
192
-
193
-
194
-
195
-
196
-
197
-
198
-
199
-
200
-
201
-
202
-
203
-
204
-
205
-
206
-
207
-
208
-
209
-
210
-
211
-
212
-
213
-
214
-
215
-
216
-
217
-
218
-
219
-
220
-
221
-
222
-
223
-
224
-
225
-
226
-
227
-
228
-
229
-
230
-
231
-
232
-
233
-
234
-
235
-
236
-
237
-
238
-
239
-
240
-
241
-
242
-
243
-
244
-
245
-
246
-
247
-
248
-
249
-
250
-
251
-
252
-
253
-
254
-
255
-
256
-
257
-
258
-
259
-
260
-
261
-
262
-
263
-
264
-
265
-
266
-
267
-
268
-
269
-
270
-
271
-
272
-
273
-
274
-
275
-
276
-
277
-
278
-
279
-
280
-
281
-
282
-
283
-
284
-
285
-
286
-
287
-
288
 |
 |

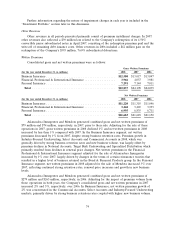
Programs business units. In the National Programs business unit, business retention rates increased over
2007, but new business levels declined compared with 2007. In the Northland business unit, business
retention rates and new business levels remained strong, but were down slightly compared with 2007.
Net written premiums of $1.02 billion in 2007 declined less than 1% from 2006. The decline was
primarily due to premium reductions in the National Programs business unit, driven by reductions in
new business volume and business retention rates due to competitive market conditions. These
reductions were largely offset by premium growth in the Northland business unit due to strong business
retention rates and new business volume.
In Business Insurance Other, the runoff healthcare, reinsurance and international business
produced minimal net written premiums in 2008, 2007 and 2006.
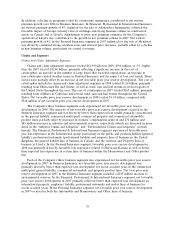
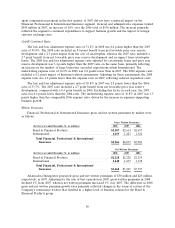
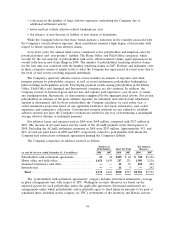
Financial, Professional & International Insurance
Results of the Company’s Financial, Professional & International Insurance segment were as
follows:
(for the year ended December 31, in millions) 2008 2007 2006
Revenues:
Earned premiums ............................ $3,429 $3,384 $3,321
Net investment income ........................ 454 494 429
Other revenues .............................. 24 29 26
Total revenues ............................... $3,907 $3,907 $3,776
Total claims and expenses ........................ $3,004 $2,981 $2,968
Operating income .............................. $ 649 $ 675 $ 609
Loss and loss adjustment expense ratio .............. 51.2% 50.8% 53.7%
Underwriting expense ratio ....................... 36.0 36.8 35.3
GAAP combined ratio ......................... 87.2% 87.6% 89.0%
Overview
Operating income of $649 million in 2008 decreased by $26 million, or 4%, from 2007. The decline
in operating income was primarily driven by an increase in the number of large losses that exceeded
expectations within International, an increase in the cost of catastrophes and a decline in net
investment income, largely offset by a significant increase in net favorable prior year reserve
development. The cost of catastrophes in 2008 was $84 million, compared with no catastrophe losses in
2007. Net favorable prior year reserve development totaled $274 and $93 million in 2008 and 2007,
respectively.
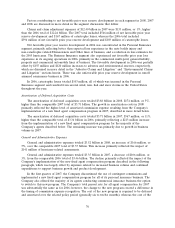
Operating income of $675 million in 2007 was $66 million, or 11%, higher than operating income
of $609 million in 2006, primarily driven by an increase in net favorable prior year reserve
development, higher net investment income and favorable current accident year results. These factors
were partially offset by an increase in general and administrative expenses and non-catastrophe losses
incurred in the United Kingdom related to flooding. Net favorable prior year reserve development
totaled $93 million in 2007, compared with $14 million in 2006.
In March 2007, the Company completed the sale of Afianzadora Insurgentes, which accounted for
$25 million and $78 million of net written premiums for the years ended December 31, 2007 and 2006,
respectively. The impact of this transaction was not material to the Company’s results of operations or
financial position.
84