Travelers 2008 Annual Report Download - page 78
Download and view the complete annual report
Please find page 78 of the 2008 Travelers annual report below. You can navigate through the pages in the report by either clicking on the pages listed below, or by using the keyword search tool below to find specific information within the annual report.-
 1
1 -
2
-
3
-
4
-
5
-
6
-
7
-
8
-
9
-
10
-
11
-
12
-
13
-
14
-
15
-
16
-
17
-
18
-
19
-
20
-
21
-
22
-
23
-
24
-
25
-
26
-
27
-
28
-
29
-
30
-
31
-
32
-
33
-
34
-
35
-
36
-
37
-
38
-
39
-
40
-
41
-
42
-
43
-
44
-
45
-
46
-
47
-
48
-
49
-
50
-
51
-
52
-
53
-
54
-
55
-
56
-
57
-
58
-
59
-
60
-
61
-
62
-
63
-
64
-
65
-
66
-
67
-
 68
68 -
 69
69 -
 70
70 -
 71
71 -
 72
72 -
 73
73 -
 74
74 -
 75
75 -
 76
76 -
 77
77 -
 78
78 -
 79
79 -
 80
80 -
 81
81 -
 82
82 -
 83
83 -
 84
84 -
 85
85 -
 86
86 -
 87
87 -
 88
88 -
89
-
90
-
91
-
92
-
93
-
94
-
95
-
96
-
97
-
98
-
99
-
100
-
101
-
102
-
103
-
104
-
105
-
106
-
107
-
108
-
109
-
110
-
111
-
112
-
113
-
114
-
115
-
116
-
117
-
118
-
119
-
120
-
121
-
122
-
123
-
124
-
125
-
126
-
127
-
128
-
129
-
130
-
131
-
132
-
133
-
134
-
135
-
136
-
137
-
138
-
139
-
140
-
141
-
142
-
143
-
144
-
145
-
146
-
147
-
148
-
149
-
150
-
151
-
152
-
153
-
154
-
155
-
156
-
157
-
158
-
159
-
160
-
161
-
162
-
163
-
164
-
165
-
166
-
167
-
168
-
169
-
170
-
171
-
172
-
173
-
174
-
175
-
176
-
177
-
178
-
179
-
180
-
181
-
182
-
183
-
184
-
185
-
186
-
187
-
188
-
189
-
190
-
191
-
192
-
193
-
194
-
195
-
196
-
197
-
198
-
199
-
200
-
201
-
202
-
203
-
204
-
205
-
206
-
207
-
208
-
209
-
210
-
211
-
212
-
213
-
214
-
215
-
216
-
217
-
218
-
219
-
220
-
221
-
222
-
223
-
224
-
225
-
226
-
227
-
228
-
229
-
230
-
231
-
232
-
233
-
234
-
235
-
236
-
237
-
238
-
239
-
240
-
241
-
242
-
243
-
244
-
245
-
246
-
247
-
248
-
249
-
250
-
251
-
252
-
253
-
254
-
255
-
256
-
257
-
258
-
259
-
260
-
261
-
262
-
263
-
264
-
265
-
266
-
267
-
268
-
269
-
270
-
271
-
272
-
273
-
274
-
275
-
276
-
277
-
278
-
279
-
280
-
281
-
282
-
283
-
284
-
285
-
286
-
287
-
288
 |
 |
17FEB200921245354
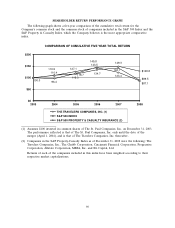
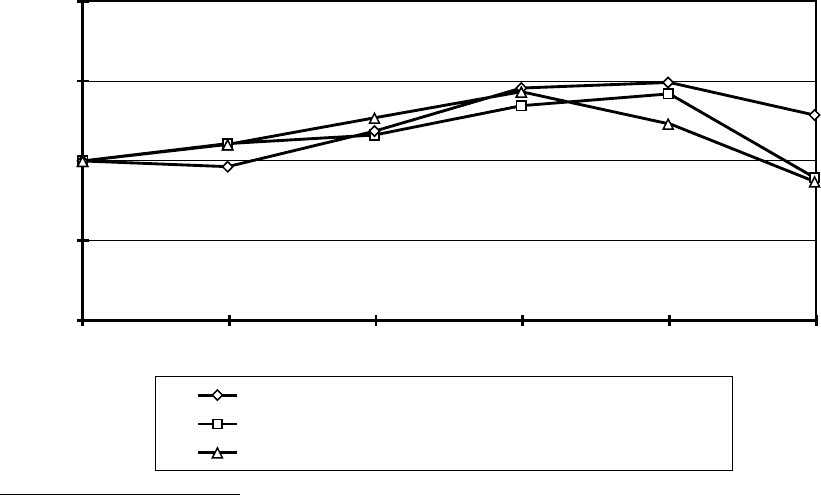
SHAREHOLDER RETURN PERFORMANCE GRAPH
The following graph shows a five-year comparison of the cumulative total return for the
Company’s common stock and the common stock of companies included in the S&P 500 Index and the
S&P Property & Casualty Index, which the Company believes is the most appropriate comparative
index.
2003 2004 2005 2006 20082007
THE TRAVELERS COMPANIES, INC. (1)
S&P 500 INDEX
S&P 500 PROPERTY & CASUALTY INSURANCE (2)
COMPARISON OF CUMULATIVE FIVE YEAR TOTAL RETURN
100.0 96.4
110.4
110.9
116.3
118.7
127.1
145.8
143.5
134.7 142.1
123.4
149.3
$128.8
$89.5
$87.1
$0
$50
$100
$150
$200
(1) Assumes $100 invested in common shares of The St. Paul Companies, Inc. on December 31, 2003.
The performance reflected is that of The St. Paul Companies, Inc. only until the date of the
merger (April 1, 2004), and is that of The Travelers Companies, Inc. thereafter.
(2) Companies in the S&P Property-Casualty Index as of December 31, 2008 were the following: The
Travelers Companies, Inc., The Chubb Corporation, Cincinnati Financial Corporation, Progressive
Corporation, Allstate Corporation, MBIA, Inc. and XL Capital, Ltd.
Returns of each of the companies included in this index have been weighted according to their
respective market capitalizations.
66