Travelers 2008 Annual Report Download - page 117
Download and view the complete annual report
Please find page 117 of the 2008 Travelers annual report below. You can navigate through the pages in the report by either clicking on the pages listed below, or by using the keyword search tool below to find specific information within the annual report.-
 1
1 -
2
-
3
-
4
-
5
-
6
-
7
-
8
-
9
-
10
-
11
-
12
-
13
-
14
-
15
-
16
-
17
-
18
-
19
-
20
-
21
-
22
-
23
-
24
-
25
-
26
-
27
-
28
-
29
-
30
-
31
-
32
-
33
-
34
-
35
-
36
-
37
-
38
-
39
-
40
-
41
-
42
-
43
-
44
-
45
-
46
-
47
-
48
-
49
-
50
-
51
-
52
-
53
-
54
-
55
-
56
-
57
-
58
-
59
-
60
-
61
-
62
-
63
-
64
-
65
-
66
-
67
-
68
-
69
-
70
-
71
-
72
-
73
-
74
-
75
-
76
-
77
-
78
-
79
-
80
-
81
-
82
-
83
-
84
-
85
-
86
-
87
-
88
-
89
-
90
-
91
-
92
-
93
-
94
-
95
-
96
-
97
-
98
-
99
-
100
-
101
-
102
-
103
-
104
-
105
-
106
-
 107
107 -
 108
108 -
 109
109 -
 110
110 -
 111
111 -
 112
112 -
 113
113 -
 114
114 -
 115
115 -
 116
116 -
 117
117 -
 118
118 -
 119
119 -
 120
120 -
 121
121 -
 122
122 -
 123
123 -
 124
124 -
 125
125 -
 126
126 -
 127
127 -
128
-
129
-
130
-
131
-
132
-
133
-
134
-
135
-
136
-
137
-
138
-
139
-
140
-
141
-
142
-
143
-
144
-
145
-
146
-
147
-
148
-
149
-
150
-
151
-
152
-
153
-
154
-
155
-
156
-
157
-
158
-
159
-
160
-
161
-
162
-
163
-
164
-
165
-
166
-
167
-
168
-
169
-
170
-
171
-
172
-
173
-
174
-
175
-
176
-
177
-
178
-
179
-
180
-
181
-
182
-
183
-
184
-
185
-
186
-
187
-
188
-
189
-
190
-
191
-
192
-
193
-
194
-
195
-
196
-
197
-
198
-
199
-
200
-
201
-
202
-
203
-
204
-
205
-
206
-
207
-
208
-
209
-
210
-
211
-
212
-
213
-
214
-
215
-
216
-
217
-
218
-
219
-
220
-
221
-
222
-
223
-
224
-
225
-
226
-
227
-
228
-
229
-
230
-
231
-
232
-
233
-
234
-
235
-
236
-
237
-
238
-
239
-
240
-
241
-
242
-
243
-
244
-
245
-
246
-
247
-
248
-
249
-
250
-
251
-
252
-
253
-
254
-
255
-
256
-
257
-
258
-
259
-
260
-
261
-
262
-
263
-
264
-
265
-
266
-
267
-
268
-
269
-
270
-
271
-
272
-
273
-
274
-
275
-
276
-
277
-
278
-
279
-
280
-
281
-
282
-
283
-
284
-
285
-
286
-
287
-
288
 |
 |

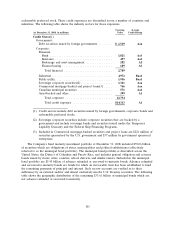
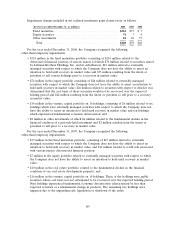
Impairment charges included in net realized investment gains (losses) were as follows:
(for the year ended December 31, in millions) 2008 2007 2006
Fixed maturities .................................... $324 $37 $ 7
Equity securities .................................... 74 74
Other investments ................................... 22 26 37
Total ........................................... $420 $70 $48
For the year ended December 31, 2008, the Company recognized the following
other-than-temporary impairments:
• $324 million in the fixed maturities portfolio, consisting of $210 million related to the
deteriorated financial position of various issuers (of which $70 million related to securities issued
by Lehman Brothers Holdings, Inc. and its subsidiaries), $81 million related to externally
managed securities with respect to which the Company does not have the ability to assert an
intention to hold until recovery in market value and $33 million resulting from the intent or
potential to sell various holdings prior to a recovery in market value;
• $74 million in the equity portfolio consisting of $26 million related to externally managed
securities with respect to which the Company does not have the ability to assert an intention to
hold until recovery in market value, $26 million related to securities with respect to which it was
determined that the cost basis of those securities would not be recovered over the expected
holding period and $22 million resulting from the intent or potential to sell prior to a recovery
in market value;
• $14 million in the venture capital portfolio on 16 holdings, consisting of $6 million related to six
holdings which were externally managed securities with respect to which the Company does not
have the ability to assert an intention to hold until recovery in market value and ten holdings
which experienced fundamental economic deterioration; and
• $8 million in other investments of which $6 million related to the fundamental decline in the
financial condition of a privately-held investment and $2 million resulted from the intent or
potential to sell prior to a recovery in market value.
For the year ended December 31, 2007, the Company recognized the following
other-than-temporary impairments:
• $37 million in the fixed maturities portfolio, consisting of $23 million related to externally
managed securities with respect to which the Company does not have the ability to assert an
intention to hold until recovery in market value, and $14 million related to credit risk associated
with various issuers’ deteriorated financial position;
• $7 million in the equity portfolio related to externally managed securities with respect to which
the Company does not have the ability to assert an intention to hold until recovery in market
value;
• $10 million in the real estate portfolio, related to the fundamental decline in the financial
condition of one real estate development property; and
• $16 million in the venture capital portfolio on 14 holdings. Three of the holdings were public
securities whose cost basis was not anticipated to be recovered over the expected holding period.
Nine holdings experienced fundamental economic deterioration (characterized by less than
expected revenues or a fundamental change in product). The remaining two holdings were
impaired due to the impending sale, liquidation or shutdown of the entity.
105