Travelers 2008 Annual Report Download - page 95
Download and view the complete annual report
Please find page 95 of the 2008 Travelers annual report below. You can navigate through the pages in the report by either clicking on the pages listed below, or by using the keyword search tool below to find specific information within the annual report.-
 1
1 -
2
-
3
-
4
-
5
-
6
-
7
-
8
-
9
-
10
-
11
-
12
-
13
-
14
-
15
-
16
-
17
-
18
-
19
-
20
-
21
-
22
-
23
-
24
-
25
-
26
-
27
-
28
-
29
-
30
-
31
-
32
-
33
-
34
-
35
-
36
-
37
-
38
-
39
-
40
-
41
-
42
-
43
-
44
-
45
-
46
-
47
-
48
-
49
-
50
-
51
-
52
-
53
-
54
-
55
-
56
-
57
-
58
-
59
-
60
-
61
-
62
-
63
-
64
-
65
-
66
-
67
-
68
-
69
-
70
-
71
-
72
-
73
-
74
-
75
-
76
-
77
-
78
-
79
-
80
-
81
-
82
-
83
-
84
-
 85
85 -
 86
86 -
 87
87 -
 88
88 -
 89
89 -
 90
90 -
 91
91 -
 92
92 -
 93
93 -
 94
94 -
 95
95 -
 96
96 -
 97
97 -
 98
98 -
 99
99 -
 100
100 -
 101
101 -
 102
102 -
 103
103 -
 104
104 -
 105
105 -
106
-
107
-
108
-
109
-
110
-
111
-
112
-
113
-
114
-
115
-
116
-
117
-
118
-
119
-
120
-
121
-
122
-
123
-
124
-
125
-
126
-
127
-
128
-
129
-
130
-
131
-
132
-
133
-
134
-
135
-
136
-
137
-
138
-
139
-
140
-
141
-
142
-
143
-
144
-
145
-
146
-
147
-
148
-
149
-
150
-
151
-
152
-
153
-
154
-
155
-
156
-
157
-
158
-
159
-
160
-
161
-
162
-
163
-
164
-
165
-
166
-
167
-
168
-
169
-
170
-
171
-
172
-
173
-
174
-
175
-
176
-
177
-
178
-
179
-
180
-
181
-
182
-
183
-
184
-
185
-
186
-
187
-
188
-
189
-
190
-
191
-
192
-
193
-
194
-
195
-
196
-
197
-
198
-
199
-
200
-
201
-
202
-
203
-
204
-
205
-
206
-
207
-
208
-
209
-
210
-
211
-
212
-
213
-
214
-
215
-
216
-
217
-
218
-
219
-
220
-
221
-
222
-
223
-
224
-
225
-
226
-
227
-
228
-
229
-
230
-
231
-
232
-
233
-
234
-
235
-
236
-
237
-
238
-
239
-
240
-
241
-
242
-
243
-
244
-
245
-
246
-
247
-
248
-
249
-
250
-
251
-
252
-
253
-
254
-
255
-
256
-
257
-
258
-
259
-
260
-
261
-
262
-
263
-
264
-
265
-
266
-
267
-
268
-
269
-
270
-
271
-
272
-
273
-
274
-
275
-
276
-
277
-
278
-
279
-
280
-
281
-
282
-
283
-
284
-
285
-
286
-
287
-
288
 |
 |
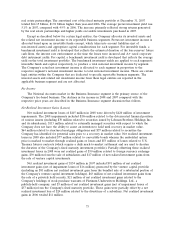
price changes were slightly negative in 2008, and were lower than in 2007. New business levels also
declined when compared with 2007, reflecting competitive market conditions in this market.
Net written premiums of $2.52 billion in 2007 grew 6% over 2006, primarily driven by an increase
in new business volume, coupled with continued strong business retention rates. The growth in new
business volume reflected the impact of product introductions, additional products sold to existing
customers and increased marketing efforts. Renewal price changes in this market declined from 2006
and were negative in 2007, primarily reflecting competitive market conditions.
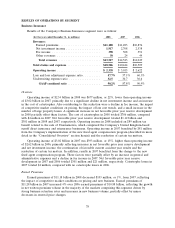
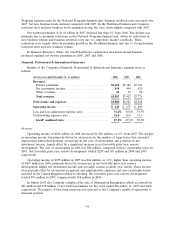
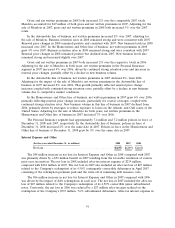
National Accounts. Net written premiums of $1.00 billion in 2008 decreased 6% from 2007. The
decline primarily reflected a significant decline in renewal price changes, as the price charged for
National Accounts’ products is adjusted based on actual loss performance, which continues to be
favorable due to workers’ compensation reforms. Overall new business volume increased slightly over
2007. Business retention rates in 2008 remained strong and increased over 2007.
Net written premiums of $1.06 billion in 2007 declined 7% from 2006, primarily reflecting
competitive market conditions that resulted in lower business volume.
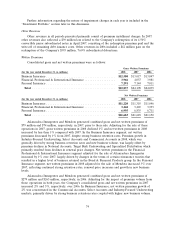
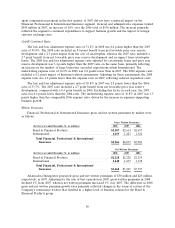
Industry-Focused Underwriting. Net written premiums of $2.40 billion in 2008 increased 4% over
2007. All business units in this market recorded net written premium growth in 2008. Growth in
Construction net written premiums in 2008 was driven by strong business retention levels coupled with
continued strong new business volume. An increase in new business volume was the primary factor in
the growth in net written premiums in the Oil & Gas business unit. In Agribusiness, net written
premium growth was driven by increases in business retention rates and renewal price changes. In the
Public Sector business unit, the increase in net written premiums was driven by higher new business
volume coupled with continued strong business retention rates.
Net written premiums of $2.30 billion in 2007 increased 5% over 2006. The increase was driven by
the Construction business unit, where favorable economic conditions contributed to higher new business
volume; the Oil & Gas business unit, due to increased business retention rates and strong renewal price
changes; and the Public Sector unit, due to an increase in retention rates. In addition, strong new
business volume and business retention rates in the Agribusiness business unit contributed to premium
growth in 2007. Net written premiums in the Technology business unit in 2007 were level with 2006.
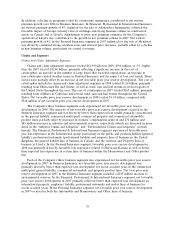
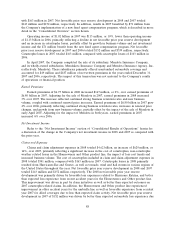
Target Risk Underwriting. Net written premiums of $1.59 billion in 2008 decreased 4% from 2007.
The decline was concentrated in the National Property business unit, reflecting reductions in renewal
price changes and new business volume due to competitive market conditions, and in the Inland
Marine business unit, primarily reflecting reductions in business retention rates and new business
volume due to general economic conditions. In addition, the Global Accounts business unit experienced
a reduction in net written premiums due to declines in business retention rates, renewal price changes
and new business. Partially offsetting the declines in these business units was an increase in net written
premiums in the Excess Casualty business unit, where renewal price changes remained negative but
improved over 2007 and business retention levels increased.
Net written premiums of $1.67 billion in 2007 grew 2% over 2006, driven by increases in the
Inland Marine and National Property business units. Strong growth in new business volume accounted
for the increase in Inland Marine net written premiums, whereas National Property’s premium growth
was driven by continued strong business retention rates and a decline in premiums ceded for
catastrophe reinsurance coverage, partially offset by a decrease in renewal price changes, which were
negative. Growth in these two business units was partially offset by a decline in Excess Casualty net
written premiums.
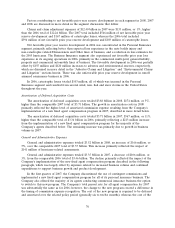
Specialized Distribution. Net written premiums of $939 million in 2008 decreased 7% from 2007.
The premium decline reflected negative renewal price changes in both the Northland and National
83