Travelers 2008 Annual Report Download - page 195
Download and view the complete annual report
Please find page 195 of the 2008 Travelers annual report below. You can navigate through the pages in the report by either clicking on the pages listed below, or by using the keyword search tool below to find specific information within the annual report.-
 1
1 -
2
-
3
-
4
-
5
-
6
-
7
-
8
-
9
-
10
-
11
-
12
-
13
-
14
-
15
-
16
-
17
-
18
-
19
-
20
-
21
-
22
-
23
-
24
-
25
-
26
-
27
-
28
-
29
-
30
-
31
-
32
-
33
-
34
-
35
-
36
-
37
-
38
-
39
-
40
-
41
-
42
-
43
-
44
-
45
-
46
-
47
-
48
-
49
-
50
-
51
-
52
-
53
-
54
-
55
-
56
-
57
-
58
-
59
-
60
-
61
-
62
-
63
-
64
-
65
-
66
-
67
-
68
-
69
-
70
-
71
-
72
-
73
-
74
-
75
-
76
-
77
-
78
-
79
-
80
-
81
-
82
-
83
-
84
-
85
-
86
-
87
-
88
-
89
-
90
-
91
-
92
-
93
-
94
-
95
-
96
-
97
-
98
-
99
-
100
-
101
-
102
-
103
-
104
-
105
-
106
-
107
-
108
-
109
-
110
-
111
-
112
-
113
-
114
-
115
-
116
-
117
-
118
-
119
-
120
-
121
-
122
-
123
-
124
-
125
-
126
-
127
-
128
-
129
-
130
-
131
-
132
-
133
-
134
-
135
-
136
-
137
-
138
-
139
-
140
-
141
-
142
-
143
-
144
-
145
-
146
-
147
-
148
-
149
-
150
-
151
-
152
-
153
-
154
-
155
-
156
-
157
-
158
-
159
-
160
-
161
-
162
-
163
-
164
-
165
-
166
-
167
-
168
-
169
-
170
-
171
-
172
-
173
-
174
-
175
-
176
-
177
-
178
-
179
-
180
-
181
-
182
-
183
-
184
-
 185
185 -
 186
186 -
 187
187 -
 188
188 -
 189
189 -
 190
190 -
 191
191 -
 192
192 -
 193
193 -
 194
194 -
 195
195 -
 196
196 -
 197
197 -
 198
198 -
 199
199 -
 200
200 -
 201
201 -
 202
202 -
 203
203 -
 204
204 -
 205
205 -
206
-
207
-
208
-
209
-
210
-
211
-
212
-
213
-
214
-
215
-
216
-
217
-
218
-
219
-
220
-
221
-
222
-
223
-
224
-
225
-
226
-
227
-
228
-
229
-
230
-
231
-
232
-
233
-
234
-
235
-
236
-
237
-
238
-
239
-
240
-
241
-
242
-
243
-
244
-
245
-
246
-
247
-
248
-
249
-
250
-
251
-
252
-
253
-
254
-
255
-
256
-
257
-
258
-
259
-
260
-
261
-
262
-
263
-
264
-
265
-
266
-
267
-
268
-
269
-
270
-
271
-
272
-
273
-
274
-
275
-
276
-
277
-
278
-
279
-
280
-
281
-
282
-
283
-
284
-
285
-
286
-
287
-
288
 |
 |

THE TRAVELERS COMPANIES, INC. AND SUBSIDIARIES
NOTES TO CONSOLIDATED FINANCIAL STATEMENTS (Continued)
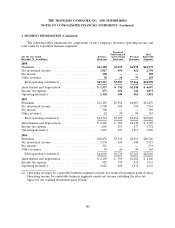
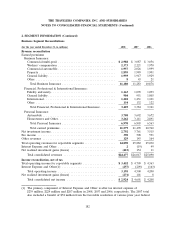
2. SEGMENT INFORMATION (Continued)
tax matters and an after-tax loss of $25 million related to the Company’s redemption of its 4.50%
contingently convertible debentures. The 2006 total also includes a $27 million after-tax gain on
the redemption of the Company’s $593 million, 7.60% subordinated debentures. See note 8.
(at December 31, in millions) 2008 2007
Asset reconciliation(1):
Business Insurance ............................... $ 82,622 $ 87,160
Financial, Professional & International Insurance ........ 13,356 14,099
Personal Insurance ............................... 13,151 13,300
Total assets for reportable segments ................. 109,129 114,559
Other assets(2) ................................. 622 665
Total consolidated assets ....................... $109,751 $115,224
(1) The amount of investments in equity method investees and total expenditures for
additions to long-lived assets other than financial instruments were not material.
(2) The major components of other assets in 2008 and 2007 were other intangible assets,
property and equipment and deferred taxes.
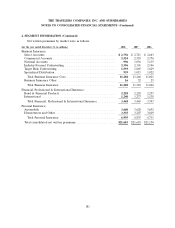
Enterprise-Wide Disclosures
Revenues from internal customers for the years ended December 31, 2008, 2007 and 2006 were not
material. Foreign assets at December 31, 2008 and 2007 also were not material. The Company does not
have revenue from transactions with a single customer amounting to 10 percent or more of its
revenues.
The following table presents revenues of the Company’s operations based on location:
(for the year ended December 31, in millions) 2008 2007 2006
U.S. ..................................... $22,809 $24,413 $23,588
Non-U.S. ................................. 1,668 1,604 1,502
Total revenues ............................ $24,477 $26,017 $25,090
183