Travelers 2008 Annual Report Download - page 90
Download and view the complete annual report
Please find page 90 of the 2008 Travelers annual report below. You can navigate through the pages in the report by either clicking on the pages listed below, or by using the keyword search tool below to find specific information within the annual report.-
 1
1 -
2
-
3
-
4
-
5
-
6
-
7
-
8
-
9
-
10
-
11
-
12
-
13
-
14
-
15
-
16
-
17
-
18
-
19
-
20
-
21
-
22
-
23
-
24
-
25
-
26
-
27
-
28
-
29
-
30
-
31
-
32
-
33
-
34
-
35
-
36
-
37
-
38
-
39
-
40
-
41
-
42
-
43
-
44
-
45
-
46
-
47
-
48
-
49
-
50
-
51
-
52
-
53
-
54
-
55
-
56
-
57
-
58
-
59
-
60
-
61
-
62
-
63
-
64
-
65
-
66
-
67
-
68
-
69
-
70
-
71
-
72
-
73
-
74
-
75
-
76
-
77
-
78
-
79
-
 80
80 -
 81
81 -
 82
82 -
 83
83 -
 84
84 -
 85
85 -
 86
86 -
 87
87 -
 88
88 -
 89
89 -
 90
90 -
 91
91 -
 92
92 -
 93
93 -
 94
94 -
 95
95 -
 96
96 -
 97
97 -
 98
98 -
 99
99 -
 100
100 -
101
-
102
-
103
-
104
-
105
-
106
-
107
-
108
-
109
-
110
-
111
-
112
-
113
-
114
-
115
-
116
-
117
-
118
-
119
-
120
-
121
-
122
-
123
-
124
-
125
-
126
-
127
-
128
-
129
-
130
-
131
-
132
-
133
-
134
-
135
-
136
-
137
-
138
-
139
-
140
-
141
-
142
-
143
-
144
-
145
-
146
-
147
-
148
-
149
-
150
-
151
-
152
-
153
-
154
-
155
-
156
-
157
-
158
-
159
-
160
-
161
-
162
-
163
-
164
-
165
-
166
-
167
-
168
-
169
-
170
-
171
-
172
-
173
-
174
-
175
-
176
-
177
-
178
-
179
-
180
-
181
-
182
-
183
-
184
-
185
-
186
-
187
-
188
-
189
-
190
-
191
-
192
-
193
-
194
-
195
-
196
-
197
-
198
-
199
-
200
-
201
-
202
-
203
-
204
-
205
-
206
-
207
-
208
-
209
-
210
-
211
-
212
-
213
-
214
-
215
-
216
-
217
-
218
-
219
-
220
-
221
-
222
-
223
-
224
-
225
-
226
-
227
-
228
-
229
-
230
-
231
-
232
-
233
-
234
-
235
-
236
-
237
-
238
-
239
-
240
-
241
-
242
-
243
-
244
-
245
-
246
-
247
-
248
-
249
-
250
-
251
-
252
-
253
-
254
-
255
-
256
-
257
-
258
-
259
-
260
-
261
-
262
-
263
-
264
-
265
-
266
-
267
-
268
-
269
-
270
-
271
-
272
-
273
-
274
-
275
-
276
-
277
-
278
-
279
-
280
-
281
-
282
-
283
-
284
-
285
-
286
-
287
-
288
 |
 |

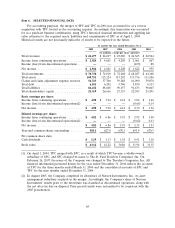
RESULTS OF OPERATIONS BY SEGMENT
Business Insurance
Results of the Company’s Business Insurance segment were as follows:
(for the year ended December 31, in millions) 2008 2007 2006
Revenues:
Earned premiums ........................ $11,180 $11,283 $10,876
Net investment income .................... 1,917 2,708 2,538
Fee income ............................ 390 508 591
Other revenues ......................... 30 24 44
Total revenues ........................ $13,517 $14,523 $14,049
Total claims and expenses ................... $10,506 $10,444 $10,509
Operating income ......................... $ 2,338 $ 3,015 $ 2,622
Loss and loss adjustment expense ratio .......... 57.7% 57.1% 60.3%
Underwriting expense ratio .................. 32.5 30.7 30.6
GAAP combined ratio ................... 90.2% 87.8% 90.9%
Overview
Operating income of $2.34 billion in 2008 was $677 million, or 22%, lower than operating income
of $3.02 billion in 2007, primarily due to a significant decline in net investment income and an increase
in the cost of catastrophes. Also contributing to this reduction were a decline in fee income, the impact
of competitive market conditions on pricing, the impact of loss cost trends, and a small increase in the
number of large property losses. A significant increase in net favorable prior year reserve development
in 2008 partially offset these factors. The cost of catastrophes in 2008 totaled $706 million, compared
with $4 million in 2007. Net favorable prior year reserve development totaled $1.12 billion and
$301 million in 2008 and 2007, respectively. Operating income in 2008 included an $89 million tax
benefit related to the sale of Unionamerica, which comprised the Company’s United Kingdom-based
runoff direct insurance and reinsurance businesses. Operating income in 2007 benefited by $81 million
from the Company’s implementation of the new fixed agent compensation program (described in more
detail in the ‘‘Consolidated Overview’’ section herein) and the resolution of certain tax matters.
Operating income of $3.02 billion in 2007 was $393 million, or 15%, higher than operating income
of $2.62 billion in 2006, primarily reflecting increases in net favorable prior year reserve development
and net investment income, the continuation of favorable current accident year results and the
resolution of certain tax matters. In addition, results in 2007 benefited from the change to the new
fixed agent compensation program. These factors were partially offset by an increase in general and
administrative expenses and a decline in fee income in 2007. Net favorable prior year reserve
development in 2007 and 2006 totaled $301 million and $21 million, respectively. Catastrophe losses in
2007 totaled $4 million, compared with no catastrophe losses in 2006.
Earned Premiums
Earned premiums of $11.18 billion in 2008 decreased $103 million, or 1%, from 2007, reflecting
the impact of competitive market conditions on pricing and new business. Earned premiums of
$11.28 billion in 2007 increased 4% over 2006 earned premiums of $10.88 billion, reflecting the growth
in net written premium volume in the majority of the markets comprising this segment, driven by
strong business retention rates and increases in new business volume, partially offset by minor
decreases in renewal price changes.
78