Travelers 2008 Annual Report Download - page 114
Download and view the complete annual report
Please find page 114 of the 2008 Travelers annual report below. You can navigate through the pages in the report by either clicking on the pages listed below, or by using the keyword search tool below to find specific information within the annual report.-
 1
1 -
2
-
3
-
4
-
5
-
6
-
7
-
8
-
9
-
10
-
11
-
12
-
13
-
14
-
15
-
16
-
17
-
18
-
19
-
20
-
21
-
22
-
23
-
24
-
25
-
26
-
27
-
28
-
29
-
30
-
31
-
32
-
33
-
34
-
35
-
36
-
37
-
38
-
39
-
40
-
41
-
42
-
43
-
44
-
45
-
46
-
47
-
48
-
49
-
50
-
51
-
52
-
53
-
54
-
55
-
56
-
57
-
58
-
59
-
60
-
61
-
62
-
63
-
64
-
65
-
66
-
67
-
68
-
69
-
70
-
71
-
72
-
73
-
74
-
75
-
76
-
77
-
78
-
79
-
80
-
81
-
82
-
83
-
84
-
85
-
86
-
87
-
88
-
89
-
90
-
91
-
92
-
93
-
94
-
95
-
96
-
97
-
98
-
99
-
100
-
101
-
102
-
103
-
 104
104 -
 105
105 -
 106
106 -
 107
107 -
 108
108 -
 109
109 -
 110
110 -
 111
111 -
 112
112 -
 113
113 -
 114
114 -
 115
115 -
 116
116 -
 117
117 -
 118
118 -
 119
119 -
 120
120 -
 121
121 -
 122
122 -
 123
123 -
 124
124 -
125
-
126
-
127
-
128
-
129
-
130
-
131
-
132
-
133
-
134
-
135
-
136
-
137
-
138
-
139
-
140
-
141
-
142
-
143
-
144
-
145
-
146
-
147
-
148
-
149
-
150
-
151
-
152
-
153
-
154
-
155
-
156
-
157
-
158
-
159
-
160
-
161
-
162
-
163
-
164
-
165
-
166
-
167
-
168
-
169
-
170
-
171
-
172
-
173
-
174
-
175
-
176
-
177
-
178
-
179
-
180
-
181
-
182
-
183
-
184
-
185
-
186
-
187
-
188
-
189
-
190
-
191
-
192
-
193
-
194
-
195
-
196
-
197
-
198
-
199
-
200
-
201
-
202
-
203
-
204
-
205
-
206
-
207
-
208
-
209
-
210
-
211
-
212
-
213
-
214
-
215
-
216
-
217
-
218
-
219
-
220
-
221
-
222
-
223
-
224
-
225
-
226
-
227
-
228
-
229
-
230
-
231
-
232
-
233
-
234
-
235
-
236
-
237
-
238
-
239
-
240
-
241
-
242
-
243
-
244
-
245
-
246
-
247
-
248
-
249
-
250
-
251
-
252
-
253
-
254
-
255
-
256
-
257
-
258
-
259
-
260
-
261
-
262
-
263
-
264
-
265
-
266
-
267
-
268
-
269
-
270
-
271
-
272
-
273
-
274
-
275
-
276
-
277
-
278
-
279
-
280
-
281
-
282
-
283
-
284
-
285
-
286
-
287
-
288
 |
 |

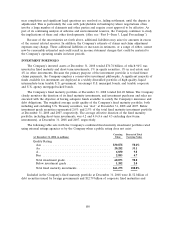
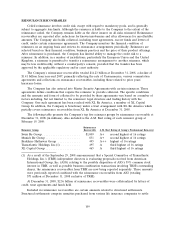
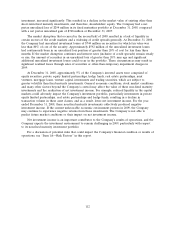
State Local Total Average
General General Market Quality
State (in millions) Obligation Obligation Revenue Value Rating(1)
Texas ................................. $ 379 $ 1,988 $ 1,362 $ 3,729 Aaa/Aa1
California ............................. 138 1,472 382 1,992 Aa1
Illinois ................................ 347 995 605 1,947 Aa1
Virginia ............................... 184 713 712 1,609 Aaa/Aa1
Florida ............................... 525 79 944 1,548 Aa1
Washington ............................ 420 699 383 1,502 Aa1
Maryland .............................. 499 576 247 1,322 Aaa/Aa1
Ohio ................................. 467 330 458 1,255 Aa1
Minnesota ............................. 427 606 211 1,244 Aaa/Aa1
Georgia ............................... 476 387 345 1,208 Aaa/Aa1
New York ............................. 49 191 930 1,170 Aa1
Arizona ............................... — 454 627 1,081 Aa1
North Carolina .......................... 522 436 118 1,076 Aaa
Michigan .............................. 157 337 530 1,024 Aa1
All Others(2) ........................... 3,255 3,509 5,135 11,899 Aa1
Total ............................... $7,845 $12,772 $12,989 $33,606 Aa1
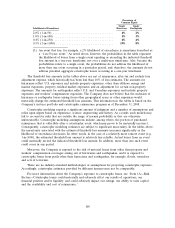
(1) Rated using external ratings agencies or by the Company when a public rating does not exist.
Ratings shown are the higher of the rating of the underlying issuer or the insurer in the case of
securities enhanced by third-party insurance for the payment of principal and interest in the event
of issuer default.
(2) No other single state accounted for 3.0% or more of the total non-advance-refunded or
escrowed-to-maturity municipal bonds.
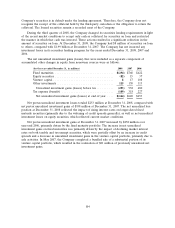
The Company bases its investment decision on the credit characteristics of the municipal security;
however, within its municipal bond portfolio are a number of securities that were enhanced by third-
party insurance for the payment of principal and interest in the event of an issuer default. The
downgrade during 2008 of credit ratings of insurers of these securities has resulted in a corresponding
downgrade in the ratings of the securities to the underlying rating of the respective security. Of the
insured municipal securities in the Company’s investment portfolio, approximately 99% were rated at
A3 or above, and approximately 81% were rated at Aa3 or above, without the benefit of insurance.
The Company believes that a further loss of the benefit of insurance would not result in a material
adverse impact on the Company’s results of operations, financial position or liquidity, due to the
underlying credit strength of the issuers of the securities, as well as the Company’s ability and intent to
hold the securities. The average credit rating of the underlying issuers of these securities was ‘‘Aa3’’ at
December 31, 2008. The average credit rating of the entire municipal bond portfolio was ‘‘Aa1’’ at
December 31, 2008 with and without the third-party insurance.
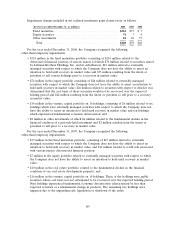
At December 31, 2008 and 2007, the Company held commercial mortgage-backed securities
(CMBS, including FHA project loans) of $766 million and $935 million, respectively. At December 31,
2008, approximately $258 million of these securities, or the loans backing such securities, contain
guarantees by the United States Government or a government-sponsored enterprise and $20 million
were comprised of Canadian non-guaranteed securities. The average credit rating of the $508 million of
non-guaranteed securities at December 31, 2008 was ‘‘Aaa,’’ and 93% of those securities were issued in
2004 and prior years. The CMBS portfolio is supported by loans that are diversified across economic
sectors and geographical areas. The Company does not believe this portfolio exposes it to a material
adverse impact on its results of operations, financial position or liquidity, due to the underlying credit
strength of these securities.
102