Travelers 2008 Annual Report Download - page 91
Download and view the complete annual report
Please find page 91 of the 2008 Travelers annual report below. You can navigate through the pages in the report by either clicking on the pages listed below, or by using the keyword search tool below to find specific information within the annual report.-
 1
1 -
2
-
3
-
4
-
5
-
6
-
7
-
8
-
9
-
10
-
11
-
12
-
13
-
14
-
15
-
16
-
17
-
18
-
19
-
20
-
21
-
22
-
23
-
24
-
25
-
26
-
27
-
28
-
29
-
30
-
31
-
32
-
33
-
34
-
35
-
36
-
37
-
38
-
39
-
40
-
41
-
42
-
43
-
44
-
45
-
46
-
47
-
48
-
49
-
50
-
51
-
52
-
53
-
54
-
55
-
56
-
57
-
58
-
59
-
60
-
61
-
62
-
63
-
64
-
65
-
66
-
67
-
68
-
69
-
70
-
71
-
72
-
73
-
74
-
75
-
76
-
77
-
78
-
79
-
80
-
 81
81 -
 82
82 -
 83
83 -
 84
84 -
 85
85 -
 86
86 -
 87
87 -
 88
88 -
 89
89 -
 90
90 -
 91
91 -
 92
92 -
 93
93 -
 94
94 -
 95
95 -
 96
96 -
 97
97 -
 98
98 -
 99
99 -
 100
100 -
 101
101 -
102
-
103
-
104
-
105
-
106
-
107
-
108
-
109
-
110
-
111
-
112
-
113
-
114
-
115
-
116
-
117
-
118
-
119
-
120
-
121
-
122
-
123
-
124
-
125
-
126
-
127
-
128
-
129
-
130
-
131
-
132
-
133
-
134
-
135
-
136
-
137
-
138
-
139
-
140
-
141
-
142
-
143
-
144
-
145
-
146
-
147
-
148
-
149
-
150
-
151
-
152
-
153
-
154
-
155
-
156
-
157
-
158
-
159
-
160
-
161
-
162
-
163
-
164
-
165
-
166
-
167
-
168
-
169
-
170
-
171
-
172
-
173
-
174
-
175
-
176
-
177
-
178
-
179
-
180
-
181
-
182
-
183
-
184
-
185
-
186
-
187
-
188
-
189
-
190
-
191
-
192
-
193
-
194
-
195
-
196
-
197
-
198
-
199
-
200
-
201
-
202
-
203
-
204
-
205
-
206
-
207
-
208
-
209
-
210
-
211
-
212
-
213
-
214
-
215
-
216
-
217
-
218
-
219
-
220
-
221
-
222
-
223
-
224
-
225
-
226
-
227
-
228
-
229
-
230
-
231
-
232
-
233
-
234
-
235
-
236
-
237
-
238
-
239
-
240
-
241
-
242
-
243
-
244
-
245
-
246
-
247
-
248
-
249
-
250
-
251
-
252
-
253
-
254
-
255
-
256
-
257
-
258
-
259
-
260
-
261
-
262
-
263
-
264
-
265
-
266
-
267
-
268
-
269
-
270
-
271
-
272
-
273
-
274
-
275
-
276
-
277
-
278
-
279
-
280
-
281
-
282
-
283
-
284
-
285
-
286
-
287
-
288
 |
 |
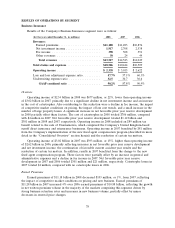
Net Investment Income
Refer to the ‘‘Net Investment Income’’ section of ‘‘Consolidated Results of Operations’’ herein for
a discussion of the change in the Company’s net investment income in 2008 and 2007 as compared with
the prior year.
Fee Income
National Accounts is the primary source of fee income due to its service businesses, which include
claim and loss prevention services to large companies that choose to self-insure a portion of their
insurance risks, and claims and policy management services to workers’ compensation residual market
pools. The $118 million and $83 million declines in fee income in 2008 and 2007, respectively, primarily
resulted from lower serviced premium volume due to the depopulation of workers’ compensation
residual market pools, the impact of lower loss costs on fee income (since fees are principally based on
a percentage of losses or number of claims serviced, both of which have declined due to workers’
compensation reforms in numerous states), and lower new business volume due to increased
competition.
Claims and Expenses
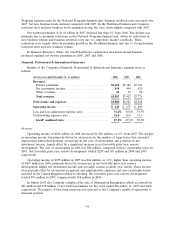
Claims and claim adjustment expenses in 2008 totaled $6.61 billion, an increase of $65 million, or
1%, over 2007, primarily reflecting a significant increase in the cost of catastrophes, a small increase in
the number of large property losses and the impact of loss cost trends, which were largely offset by an
increase in net favorable prior year reserve development. The cost of catastrophes included in claims
and claim adjustment expenses in 2008 totaled $642 million, primarily resulting from Hurricanes Ike
and Gustav as well as wind, rain and hail storms in several regions of the United States throughout the
year. Catastrophe losses in 2007 were $4 million. Net favorable prior year reserve development in 2008
and 2007 totaled $1.12 billion and $301 million, respectively. Net favorable prior year development in
2008 was driven by better than expected loss results primarily concentrated in the general liability and
commercial multi-peril product lines, an increase in anticipated ceded recoveries for older accident
years in the general liability product line and better than anticipated loss development in the
commercial property and commercial automobile product lines. The net favorable prior year reserve
development in the general liability and commercial multi-peril lines was attributable to several factors,
including improved legal and judicial environments, as well as enhanced risk control, underwriting and
claim process initiatives. The commercial property product line improvement occurred primarily in the
2007 accident year as a result of better than expected loss development for certain large national
property, national programs, and ocean marine claim exposures and lower than expected weather-
related losses during the last half of 2007, as well as favorable loss development in certain large inland
marine claim exposures and in ceded recoveries for commercial property large claims. In addition, the
commercial multi-peril and property product lines’ 2005 accident year results experienced improvement
due to the litigation environment relating to, and ongoing claim settlements for, Hurricane Katrina.
The commercial automobile product line improvement was attributable to several factors, including
improved legal and judicial environments, as well as enhanced risk control, underwriting and claim
process initiatives. The net favorable prior year reserve development in the foregoing product lines in
2008 was partially offset by net unfavorable prior year reserve development in the workers’
compensation product line, primarily driven by higher than anticipated medical costs related to 2004
and prior accident years, and by $70 million and $85 million increases to asbestos and environmental
reserves, respectively, which are discussed in more detail in the ‘‘Asbestos Claims and Litigation’’ and
‘‘Environmental Claims and Litigation’’ sections herein.
Net favorable prior year reserve development of $301 million in 2007 was primarily driven by
better than expected loss development for recent accident years in the commercial multi-peril, general
liability, commercial automobile and property product lines. The commercial multi-peril and general
79