Travelers 2008 Annual Report Download - page 120
Download and view the complete annual report
Please find page 120 of the 2008 Travelers annual report below. You can navigate through the pages in the report by either clicking on the pages listed below, or by using the keyword search tool below to find specific information within the annual report.-
 1
1 -
2
-
3
-
4
-
5
-
6
-
7
-
8
-
9
-
10
-
11
-
12
-
13
-
14
-
15
-
16
-
17
-
18
-
19
-
20
-
21
-
22
-
23
-
24
-
25
-
26
-
27
-
28
-
29
-
30
-
31
-
32
-
33
-
34
-
35
-
36
-
37
-
38
-
39
-
40
-
41
-
42
-
43
-
44
-
45
-
46
-
47
-
48
-
49
-
50
-
51
-
52
-
53
-
54
-
55
-
56
-
57
-
58
-
59
-
60
-
61
-
62
-
63
-
64
-
65
-
66
-
67
-
68
-
69
-
70
-
71
-
72
-
73
-
74
-
75
-
76
-
77
-
78
-
79
-
80
-
81
-
82
-
83
-
84
-
85
-
86
-
87
-
88
-
89
-
90
-
91
-
92
-
93
-
94
-
95
-
96
-
97
-
98
-
99
-
100
-
101
-
102
-
103
-
104
-
105
-
106
-
107
-
108
-
109
-
 110
110 -
 111
111 -
 112
112 -
 113
113 -
 114
114 -
 115
115 -
 116
116 -
 117
117 -
 118
118 -
 119
119 -
 120
120 -
 121
121 -
 122
122 -
 123
123 -
 124
124 -
 125
125 -
 126
126 -
 127
127 -
 128
128 -
 129
129 -
 130
130 -
131
-
132
-
133
-
134
-
135
-
136
-
137
-
138
-
139
-
140
-
141
-
142
-
143
-
144
-
145
-
146
-
147
-
148
-
149
-
150
-
151
-
152
-
153
-
154
-
155
-
156
-
157
-
158
-
159
-
160
-
161
-
162
-
163
-
164
-
165
-
166
-
167
-
168
-
169
-
170
-
171
-
172
-
173
-
174
-
175
-
176
-
177
-
178
-
179
-
180
-
181
-
182
-
183
-
184
-
185
-
186
-
187
-
188
-
189
-
190
-
191
-
192
-
193
-
194
-
195
-
196
-
197
-
198
-
199
-
200
-
201
-
202
-
203
-
204
-
205
-
206
-
207
-
208
-
209
-
210
-
211
-
212
-
213
-
214
-
215
-
216
-
217
-
218
-
219
-
220
-
221
-
222
-
223
-
224
-
225
-
226
-
227
-
228
-
229
-
230
-
231
-
232
-
233
-
234
-
235
-
236
-
237
-
238
-
239
-
240
-
241
-
242
-
243
-
244
-
245
-
246
-
247
-
248
-
249
-
250
-
251
-
252
-
253
-
254
-
255
-
256
-
257
-
258
-
259
-
260
-
261
-
262
-
263
-
264
-
265
-
266
-
267
-
268
-
269
-
270
-
271
-
272
-
273
-
274
-
275
-
276
-
277
-
278
-
279
-
280
-
281
-
282
-
283
-
284
-
285
-
286
-
287
-
288
 |
 |

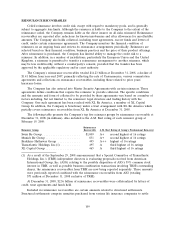
Percentage of
Common Equity
Single Single
Likelihood of Exceedance Hurricane Earthquake
2.0% (1-in-50) ................................... 4% 2%
1.0% (1-in-100) .................................. 5% 3%
0.4% (1-in-250) .................................. 8% 4%
0.1% (1-in-1,000) ................................. 19% 8%
(1) An event that has, for example, a 2% likelihood of exceedance is sometimes described as
a ‘‘1-in-50 year event.’’ As noted above, however, the probabilities in the table represent
the likelihood of losses from a single event equaling or exceeding the indicated threshold
loss amount in a one-year timeframe, not over a multi-year timeframe. Also, because the
probabilities relate to a single event, the probabilities do not address the likelihood of
more than one event occurring in a particular period, and, therefore, the amounts do not
address potential aggregate catastrophe losses occurring in a one-year timeframe.
The threshold loss amounts in the tables above are net of reinsurance, after-tax and exclude loss
adjustment expense, which historically has been less than 10% of loss estimates. The amounts for
hurricanes reflect U.S. exposures and include property exposures, other than offshore energy and
marine exposures, property residual market exposures and an adjustment for certain non-property
exposures. The amounts for earthquakes reflect U.S. and Canadian exposures and include property
exposures and workers’ compensation exposures. The Company does not believe that the inclusion of
hurricane or earthquake losses arising from other geographical areas or other exposures would
materially change the estimated threshold loss amounts. This information in the tables is based on the
Company’s in-force portfolio and catastrophic reinsurance program as of December 31, 2008.
Catastrophe modeling requires a significant amount of judgment and a number of assumptions and
relies upon inputs based on experience, science, engineering and history. As a result, such models may
fail to account for risks that are outside the range of normal probability or that are otherwise
unforeseeable. Catastrophe modeling assumptions include, among others, the portion of purchased
reinsurance that is collectible after a catastrophic event, which may prove to be materially incorrect.
Consequently, catastrophe modeling estimates are subject to significant uncertainty. In the tables above,
the uncertainty associated with the estimated threshold loss amounts increases significantly as the
likelihood of exceedance decreases. In other words, in the case of a relatively more remote event (e.g.,
1-in-1000), the estimated threshold loss amount is relatively less reliable. Actual losses from an event
could materially exceed the indicated threshold loss amount. In addition, more than one such event
could occur in any period.
Moreover, the Company is exposed to the risk of material losses from other than property and
workers’ compensation coverages arising out of hurricanes and earthquakes, and it is exposed to
catastrophe losses from perils other than hurricanes and earthquakes, for example, floods, tornadoes
and acts of terrorism.
There are no industry-standard methodologies or assumptions for projecting catastrophe exposure.
Accordingly, catastrophe estimates provided by different insurers may not be comparable.
For more information about the Company’s exposure to catastrophe losses, see ‘‘Item 1A—Risk
Factors—Catastrophe losses could materially and adversely affect our results of operations, our
financial position and/or liquidity, and could adversely impact our ratings, our ability to raise capital
and the availability and cost of reinsurance.’’
108