Travelers 2008 Annual Report Download - page 192
Download and view the complete annual report
Please find page 192 of the 2008 Travelers annual report below. You can navigate through the pages in the report by either clicking on the pages listed below, or by using the keyword search tool below to find specific information within the annual report.-
 1
1 -
2
-
3
-
4
-
5
-
6
-
7
-
8
-
9
-
10
-
11
-
12
-
13
-
14
-
15
-
16
-
17
-
18
-
19
-
20
-
21
-
22
-
23
-
24
-
25
-
26
-
27
-
28
-
29
-
30
-
31
-
32
-
33
-
34
-
35
-
36
-
37
-
38
-
39
-
40
-
41
-
42
-
43
-
44
-
45
-
46
-
47
-
48
-
49
-
50
-
51
-
52
-
53
-
54
-
55
-
56
-
57
-
58
-
59
-
60
-
61
-
62
-
63
-
64
-
65
-
66
-
67
-
68
-
69
-
70
-
71
-
72
-
73
-
74
-
75
-
76
-
77
-
78
-
79
-
80
-
81
-
82
-
83
-
84
-
85
-
86
-
87
-
88
-
89
-
90
-
91
-
92
-
93
-
94
-
95
-
96
-
97
-
98
-
99
-
100
-
101
-
102
-
103
-
104
-
105
-
106
-
107
-
108
-
109
-
110
-
111
-
112
-
113
-
114
-
115
-
116
-
117
-
118
-
119
-
120
-
121
-
122
-
123
-
124
-
125
-
126
-
127
-
128
-
129
-
130
-
131
-
132
-
133
-
134
-
135
-
136
-
137
-
138
-
139
-
140
-
141
-
142
-
143
-
144
-
145
-
146
-
147
-
148
-
149
-
150
-
151
-
152
-
153
-
154
-
155
-
156
-
157
-
158
-
159
-
160
-
161
-
162
-
163
-
164
-
165
-
166
-
167
-
168
-
169
-
170
-
171
-
172
-
173
-
174
-
175
-
176
-
177
-
178
-
179
-
180
-
181
-
 182
182 -
 183
183 -
 184
184 -
 185
185 -
 186
186 -
 187
187 -
 188
188 -
 189
189 -
 190
190 -
 191
191 -
 192
192 -
 193
193 -
 194
194 -
 195
195 -
 196
196 -
 197
197 -
 198
198 -
 199
199 -
 200
200 -
 201
201 -
 202
202 -
203
-
204
-
205
-
206
-
207
-
208
-
209
-
210
-
211
-
212
-
213
-
214
-
215
-
216
-
217
-
218
-
219
-
220
-
221
-
222
-
223
-
224
-
225
-
226
-
227
-
228
-
229
-
230
-
231
-
232
-
233
-
234
-
235
-
236
-
237
-
238
-
239
-
240
-
241
-
242
-
243
-
244
-
245
-
246
-
247
-
248
-
249
-
250
-
251
-
252
-
253
-
254
-
255
-
256
-
257
-
258
-
259
-
260
-
261
-
262
-
263
-
264
-
265
-
266
-
267
-
268
-
269
-
270
-
271
-
272
-
273
-
274
-
275
-
276
-
277
-
278
-
279
-
280
-
281
-
282
-
283
-
284
-
285
-
286
-
287
-
288
 |
 |

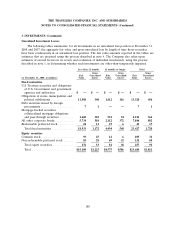
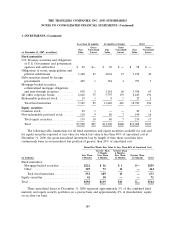
THE TRAVELERS COMPANIES, INC. AND SUBSIDIARIES
NOTES TO CONSOLIDATED FINANCIAL STATEMENTS (Continued)
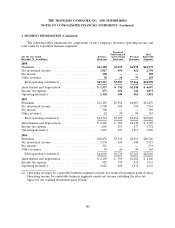
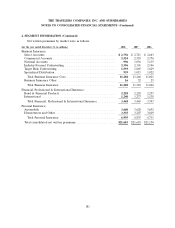
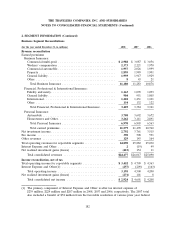
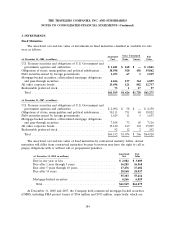
2. SEGMENT INFORMATION (Continued)
The following tables summarize the components of the Company’s revenues, operating income and
total assets by reportable business segments:
Financial,
Professional & Total
(for the year ended Business International Personal Reportable
December 31, in millions) Insurance Insurance Insurance Segments
2008
Premiums .................................. $11,180 $3,429 $6,970 $21,579
Net investment income ........................ 1,917 454 421 2,792
Fee income ................................. 390 — — 390
Other revenues .............................. 30 24 75 129
Total operating revenues(1) .................... $13,517 $3,907 $7,466 $24,890
Amortization and depreciation ................... $ 2,357 $ 796 $1,544 $ 4,697
Income tax expense ........................... 673 254 146 1,073
Operating income(1) .......................... 2,338 649 465 3,452
2007
Premiums .................................. $11,283 $3,384 $6,803 $21,470
Net investment income ........................ 2,708 494 559 3,761
Fee income ................................. 508 — — 508
Other revenues .............................. 24 29 90 143
Total operating revenues(1) .................... $14,523 $3,907 $7,452 $25,882
Amortization and depreciation ................... $ 2,278 $ 781 $1,448 $ 4,507
Income tax expense ........................... 1,064 251 437 1,752
Operating income(1) .......................... 3,015 675 1,019 4,709
2006
Premiums .................................. $10,876 $3,321 $6,563 $20,760
Net investment income ........................ 2,538 429 548 3,515
Fee income ................................. 591 — — 591
Other revenues .............................. 44 26 94 164
Total operating revenues(1) .................... $14,049 $3,776 $7,205 $25,030
Amortization and depreciation ................... $ 2,109 $ 769 $1,282 $ 4,160
Income tax expense ........................... 918 199 518 1,635
Operating income(1) .......................... 2,622 609 1,132 4,363
(1) Operating revenues for reportable business segments exclude net realized investment gains (losses).
Operating income for reportable business segments equals net income excluding the after-tax
impact of net realized investment gains (losses).
180