Travelers 2008 Annual Report Download - page 94
Download and view the complete annual report
Please find page 94 of the 2008 Travelers annual report below. You can navigate through the pages in the report by either clicking on the pages listed below, or by using the keyword search tool below to find specific information within the annual report.-
 1
1 -
2
-
3
-
4
-
5
-
6
-
7
-
8
-
9
-
10
-
11
-
12
-
13
-
14
-
15
-
16
-
17
-
18
-
19
-
20
-
21
-
22
-
23
-
24
-
25
-
26
-
27
-
28
-
29
-
30
-
31
-
32
-
33
-
34
-
35
-
36
-
37
-
38
-
39
-
40
-
41
-
42
-
43
-
44
-
45
-
46
-
47
-
48
-
49
-
50
-
51
-
52
-
53
-
54
-
55
-
56
-
57
-
58
-
59
-
60
-
61
-
62
-
63
-
64
-
65
-
66
-
67
-
68
-
69
-
70
-
71
-
72
-
73
-
74
-
75
-
76
-
77
-
78
-
79
-
80
-
81
-
82
-
83
-
 84
84 -
 85
85 -
 86
86 -
 87
87 -
 88
88 -
 89
89 -
 90
90 -
 91
91 -
 92
92 -
 93
93 -
 94
94 -
 95
95 -
 96
96 -
 97
97 -
 98
98 -
 99
99 -
 100
100 -
 101
101 -
 102
102 -
 103
103 -
 104
104 -
105
-
106
-
107
-
108
-
109
-
110
-
111
-
112
-
113
-
114
-
115
-
116
-
117
-
118
-
119
-
120
-
121
-
122
-
123
-
124
-
125
-
126
-
127
-
128
-
129
-
130
-
131
-
132
-
133
-
134
-
135
-
136
-
137
-
138
-
139
-
140
-
141
-
142
-
143
-
144
-
145
-
146
-
147
-
148
-
149
-
150
-
151
-
152
-
153
-
154
-
155
-
156
-
157
-
158
-
159
-
160
-
161
-
162
-
163
-
164
-
165
-
166
-
167
-
168
-
169
-
170
-
171
-
172
-
173
-
174
-
175
-
176
-
177
-
178
-
179
-
180
-
181
-
182
-
183
-
184
-
185
-
186
-
187
-
188
-
189
-
190
-
191
-
192
-
193
-
194
-
195
-
196
-
197
-
198
-
199
-
200
-
201
-
202
-
203
-
204
-
205
-
206
-
207
-
208
-
209
-
210
-
211
-
212
-
213
-
214
-
215
-
216
-
217
-
218
-
219
-
220
-
221
-
222
-
223
-
224
-
225
-
226
-
227
-
228
-
229
-
230
-
231
-
232
-
233
-
234
-
235
-
236
-
237
-
238
-
239
-
240
-
241
-
242
-
243
-
244
-
245
-
246
-
247
-
248
-
249
-
250
-
251
-
252
-
253
-
254
-
255
-
256
-
257
-
258
-
259
-
260
-
261
-
262
-
263
-
264
-
265
-
266
-
267
-
268
-
269
-
270
-
271
-
272
-
273
-
274
-
275
-
276
-
277
-
278
-
279
-
280
-
281
-
282
-
283
-
284
-
285
-
286
-
287
-
288
 |
 |

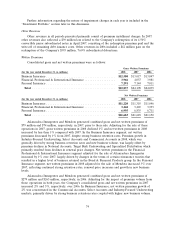
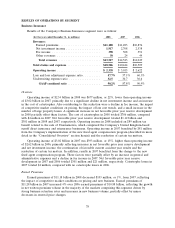
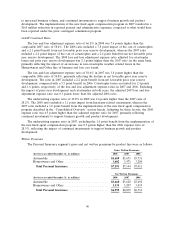
Net Written Premiums
(for the year ended December 31, in millions) 2008 2007 2006
Select Accounts ............................. $ 2,756 $ 2,711 $ 2,663
Commercial Accounts ........................ 2,524 2,518 2,376
National Accounts ........................... 996 1,056 1,135
Industry-Focused Underwriting .................. 2,396 2,301 2,196
Target Risk Underwriting ...................... 1,593 1,665 1,629
Specialized Distribution ....................... 939 1,015 1,022
Total Business Insurance Core ................ 11,204 11,266 11,021
Business Insurance Other ...................... 16 52 25
Total Business Insurance .................... $11,220 $11,318 $11,046
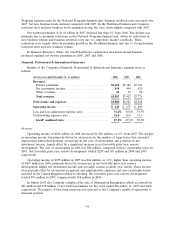
In Business Insurance Core, gross and net written premiums in 2008 decreased by 3% and 1%
from 2007, respectively. The difference in rates of decline between gross and net written premiums in
2008 was concentrated in National Accounts, where a significant portion of gross written premiums is
ceded to other insurers and residual market pools. As a result, the decline in gross written premiums
did not have a proportional impact on net written premiums. Net written premium growth in the
Industry-Focused Underwriting, Select Accounts and Commercial Accounts groups generally reflected
higher business retention levels and new business volume in several business units within these groups.
This was more than offset by premium declines in Specialized Distribution, Target Risk Underwriting
and National Accounts.
In 2007, Business Insurance Core gross written premiums declined $49 million, or less than 1%,
from the comparable 2006 total, whereas net written premiums increased $245 million, or 2%,
compared with 2006. The difference in growth rates between gross and net written premiums in 2007
was also concentrated in National Accounts due to the same factor described above. All markets in
Business Insurance Core operations, except National Accounts and Specialized Distribution, recorded
net written premium growth in 2007, driven by higher new business volume throughout the majority of
markets coupled with continued strong business retention rates, offset in some markets by minor
decreases in renewal price changes. Net written premium growth in 2007 also benefited from a
reduction in ceded premiums related to catastrophe reinsurance coverage.
Select Accounts. Net written premiums of $2.76 billion in 2008 increased 2% over 2007. Business
retention rates in 2008 remained strong and were slightly higher than in 2007. Renewal price changes
remained positive but declined from 2007. In the aggregate, new business volume in 2008 was virtually
level with 2007. The Company experienced a favorable impact on its new business volume from its
enhanced quote-to-issue agency platform and multivariate pricing program for smaller businesses served
by Select Accounts. However, new business volume for larger accounts in 2008 declined from 2007
primarily due to competitive market conditions.
Net written premiums of $2.71 billion in 2007 grew 2% over 2006. New business volume increased
over 2006, due in part to the introduction of the Company’s enhanced quote-to-issue agency platform
and multivariate pricing program in 37 states. Enhanced marketing efforts and additional products sold
to existing customers also contributed to new business growth in 2007. Business retention rates
remained strong in 2007. Renewal price changes in this market remained positive in 2007 but were
lower than in 2006, as price increases for coastal coverages were partially offset by declines in renewal
price changes for non-coastal coverages, which continue to be impacted by competitive market
conditions.
Commercial Accounts. Net written premiums of $2.52 billion in 2008 were virtually level with the
2007 total. Business retention rates in 2008 remained strong and were higher than in 2007. Renewal
82