Travelers 2008 Annual Report Download - page 92
Download and view the complete annual report
Please find page 92 of the 2008 Travelers annual report below. You can navigate through the pages in the report by either clicking on the pages listed below, or by using the keyword search tool below to find specific information within the annual report.-
 1
1 -
2
-
3
-
4
-
5
-
6
-
7
-
8
-
9
-
10
-
11
-
12
-
13
-
14
-
15
-
16
-
17
-
18
-
19
-
20
-
21
-
22
-
23
-
24
-
25
-
26
-
27
-
28
-
29
-
30
-
31
-
32
-
33
-
34
-
35
-
36
-
37
-
38
-
39
-
40
-
41
-
42
-
43
-
44
-
45
-
46
-
47
-
48
-
49
-
50
-
51
-
52
-
53
-
54
-
55
-
56
-
57
-
58
-
59
-
60
-
61
-
62
-
63
-
64
-
65
-
66
-
67
-
68
-
69
-
70
-
71
-
72
-
73
-
74
-
75
-
76
-
77
-
78
-
79
-
80
-
81
-
 82
82 -
 83
83 -
 84
84 -
 85
85 -
 86
86 -
 87
87 -
 88
88 -
 89
89 -
 90
90 -
 91
91 -
 92
92 -
 93
93 -
 94
94 -
 95
95 -
 96
96 -
 97
97 -
 98
98 -
 99
99 -
 100
100 -
 101
101 -
 102
102 -
103
-
104
-
105
-
106
-
107
-
108
-
109
-
110
-
111
-
112
-
113
-
114
-
115
-
116
-
117
-
118
-
119
-
120
-
121
-
122
-
123
-
124
-
125
-
126
-
127
-
128
-
129
-
130
-
131
-
132
-
133
-
134
-
135
-
136
-
137
-
138
-
139
-
140
-
141
-
142
-
143
-
144
-
145
-
146
-
147
-
148
-
149
-
150
-
151
-
152
-
153
-
154
-
155
-
156
-
157
-
158
-
159
-
160
-
161
-
162
-
163
-
164
-
165
-
166
-
167
-
168
-
169
-
170
-
171
-
172
-
173
-
174
-
175
-
176
-
177
-
178
-
179
-
180
-
181
-
182
-
183
-
184
-
185
-
186
-
187
-
188
-
189
-
190
-
191
-
192
-
193
-
194
-
195
-
196
-
197
-
198
-
199
-
200
-
201
-
202
-
203
-
204
-
205
-
206
-
207
-
208
-
209
-
210
-
211
-
212
-
213
-
214
-
215
-
216
-
217
-
218
-
219
-
220
-
221
-
222
-
223
-
224
-
225
-
226
-
227
-
228
-
229
-
230
-
231
-
232
-
233
-
234
-
235
-
236
-
237
-
238
-
239
-
240
-
241
-
242
-
243
-
244
-
245
-
246
-
247
-
248
-
249
-
250
-
251
-
252
-
253
-
254
-
255
-
256
-
257
-
258
-
259
-
260
-
261
-
262
-
263
-
264
-
265
-
266
-
267
-
268
-
269
-
270
-
271
-
272
-
273
-
274
-
275
-
276
-
277
-
278
-
279
-
280
-
281
-
282
-
283
-
284
-
285
-
286
-
287
-
288
 |
 |
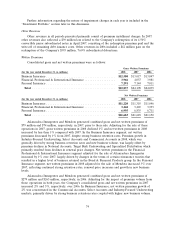
liability product lines experienced better than anticipated loss development that was attributable to
several factors, including improved legal and judicial environments, as well as enhanced risk control,
underwriting and claim process initiatives. The commercial automobile product line experienced better
than expected loss development due to more favorable legal and judicial environments, claim handling
initiatives focused on the automobile line of insurance and improvements in auto safety technology.
The property product line experienced fewer than expected late reported claims related to
non-catastrophe weather events that occurred late in 2006, as well as better than expected frequency
and severity due in part to changes in the marketplace, such as higher deductibles and lower policy
limits. In addition, the property product line experienced better than expected large loss outcomes
which were partially attributable to favorable litigation resolutions. Net total prior year reserve
development in 2007 included a $185 million increase to environmental reserves. (Refer to the
‘‘Environmental Claims and Litigation’’ section herein for additional discussion.)
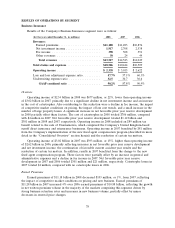
Claims and claim adjustment expenses in 2007 of $6.67 billion declined by $180 million, or 3%,
from the 2006 total of $6.85 billion, primarily reflecting an increase in net favorable prior year reserve
development and continued favorable current accident year results, partially offset by an increase in
business volume. Net favorable prior year reserve development in 2006 totaled $21 million.
In 2006, net favorable prior year reserve development in the commercial multi-peril, general
liability, property and commercial automobile lines of business was largely offset by increases totaling
$275 million to asbestos and environmental reserves and reserve strengthening for assumed reinsurance
business in runoff. The commercial multi-peril and liability lines of business experienced better than
anticipated loss development in 2006 that was attributable to several factors, including improving legal
and judicial environments, as well as enhanced risk control, underwriting and claim process initiatives.
The favorable prior year reserve development in 2006 in the property line of business primarily
reflected less ‘‘demand surge’’ inflation than originally estimated for 2005 accident year non-catastrophe
and catastrophe losses. ‘‘Demand surge’’ refers to significant short-term increases in building material
and labor costs due to a sharp increase in demand for those materials and services. The commercial
automobile line of business experienced better than expected loss development which was attributable
to more favorable legal and judicial environments, claim handling initiatives focused on the automobile
line of insurance and improvements in auto safety technology. The reserve strengthening in assumed
reinsurance was primarily due to changes in projected loss development driven by an unanticipated
change in the claim settlement patterns of the underlying casualty exposures.
The amortization of deferred acquisition costs totaled $1.82 billion in 2008, $76 million, or 4%,
higher than the comparable total of $1.74 billion in 2007. The growth in amortization costs primarily
reflected the higher level of amortized commission expense in 2008 resulting from the Company’s
implementation of a new fixed agent compensation program in 2007. The amortization of deferred
acquisition costs in 2007 was 13% higher than the 2006 total of $1.55 billion. The increase reflected the
growth in business volume, as well as a $108 million increase from the implementation of the new fixed
agent compensation program (described in more detail in the ‘‘Consolidated Overview’’ section herein).
General and administrative expenses totaled $2.08 billion in 2008, an increase of $51 million, or
3%, over the comparable 2007 total of $2.03 billion. The increase in 2008 primarily reflected the impact
of $62 million of hurricane-related assessments. General and administrative expenses in 2007 were 4%
lower than the comparable total of $2.10 billion in 2006. The implementation of the new fixed agent
compensation program in the first quarter of 2007 resulted in a reduction of $189 million in reported
general and administrative expenses in 2007 compared to what would have been reported under the
prior contingent commission program during those periods. That reduction was partially offset by an
increase in expenses related to growth in business volume and continuing expenditures to support
business growth and product development. The 2006 total included a provision for legal expenses
related to investigations of various business practices by certain governmental agencies.
80